JULY MARKET UPDATE
August 27, 2020 Real Estate
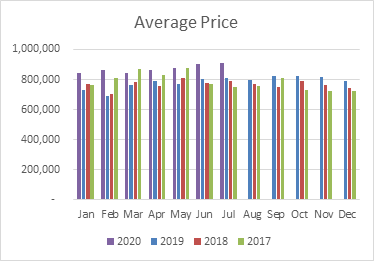
Pent-up Demand Pushes Prices Dramatically Higher
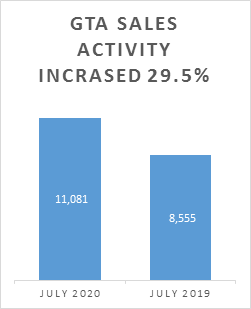
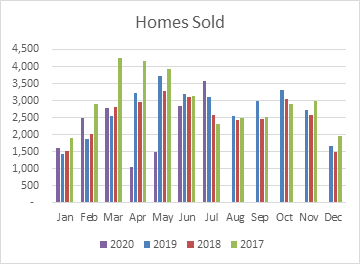
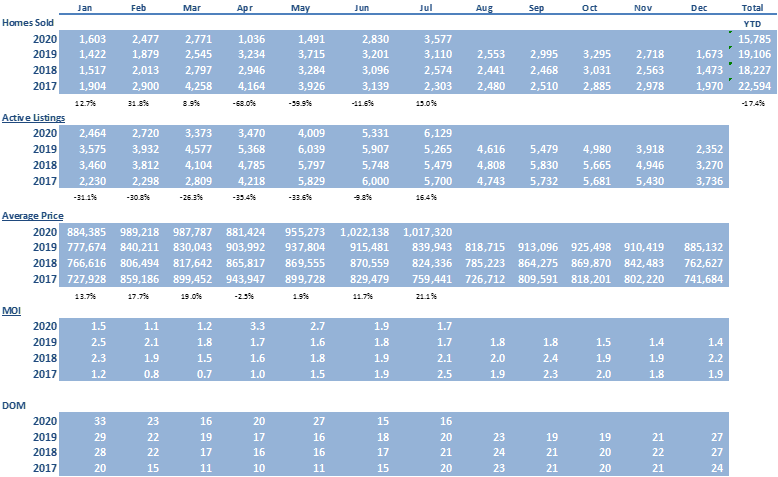
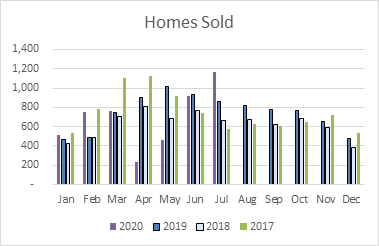
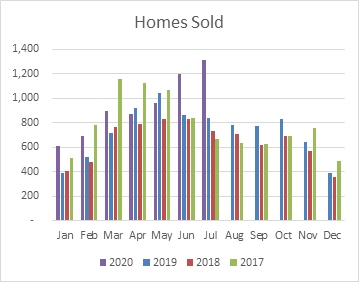
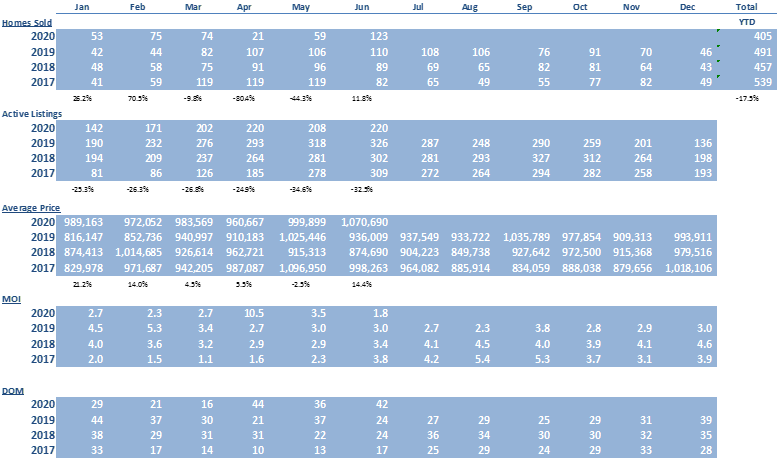
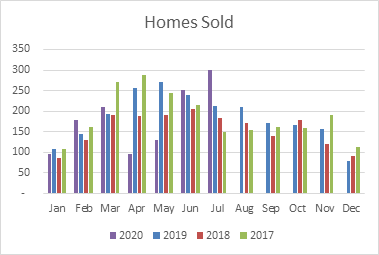
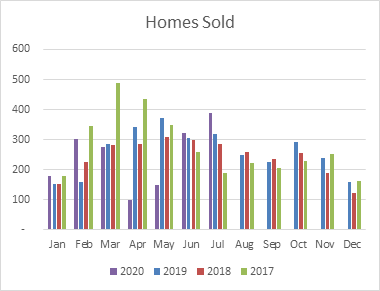
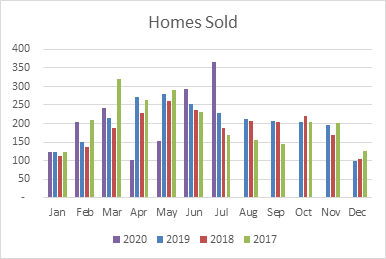
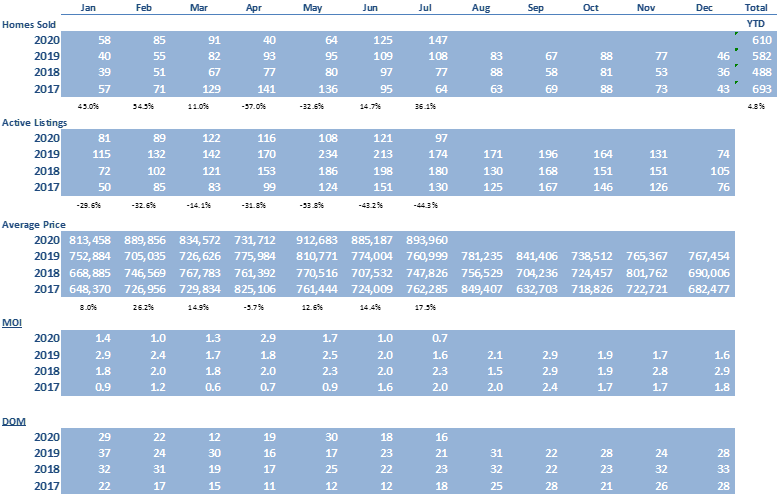
According to the Toronto Regional Real Estate Board (TRREB), sales activity was extremely strong for the first full month of summer. Normally we would see sales dip in July relative to June as more households take vacation, especially with children out of school. This year, however, was different with pent-up demand from the COVID-19-related lull in April and May being satisfied in the summer, as economic recovery takes firmer hold, including the Stage 3 re-opening. In addition, fewer people are travelling, which has likely translated into more transactions and listings. Accordingly, number of sales increased by 27% in July from this June and 29.5% from July of 2019.
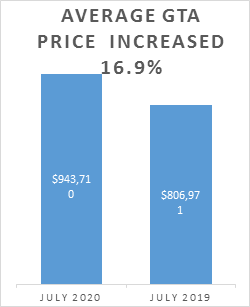
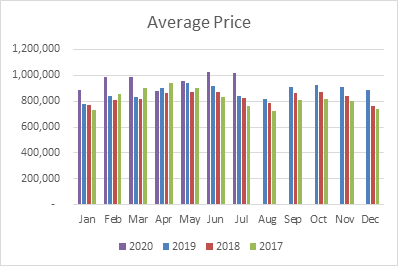
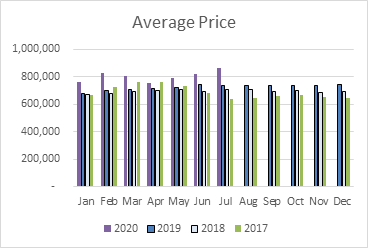
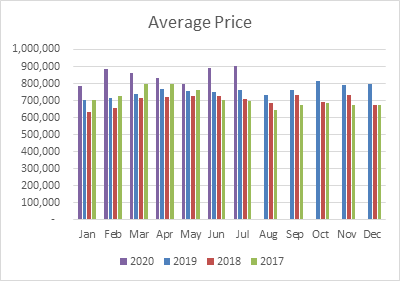
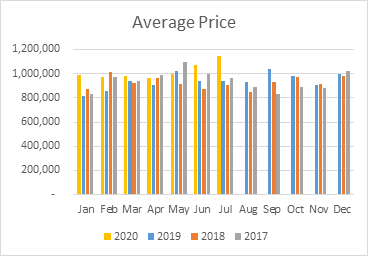
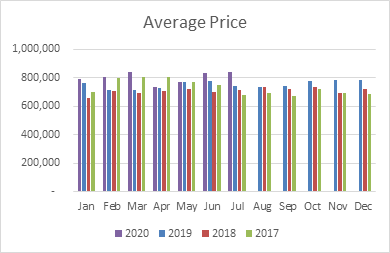
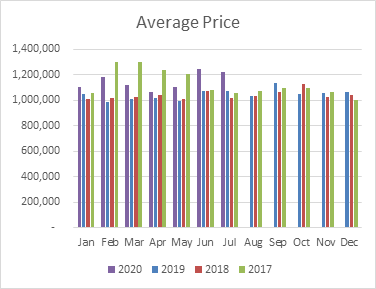
The average selling price for July of $943,710 was up 16.9% compared to July 2019.
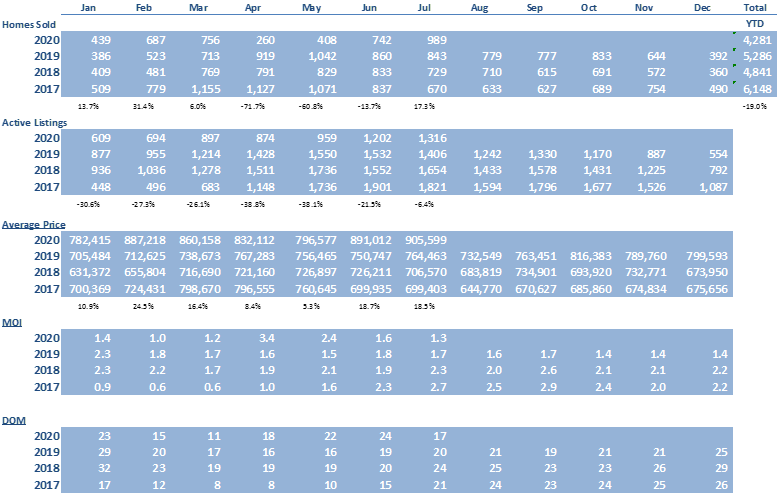
New listings for the month increased by 24.7% to 17,956 compared to July 2019, however, since sales increased at a higher rate than new listings, the active listings dropped by 16.3% to 15,018. Accordingly, homes available remain in very short supply with 1.4 months of inventory on hand at the end of July. This low supply continues to fuel multiple offers as buyers are competing for what little is available in the market. Industry insiders view anything under 4 months as tight supply and a sellers’ market, 4 to 6 months as a balanced market and above 6 as a buyers’ market. As such, the market is in deep seller market territory and we are expecting upward pressure on prices moving forward.
The trend for the MLS® Home Price Index (HPI) Composite Benchmark has been on an upward trajectory since the beginning of 2019. On a year-over-year basis, the Benchmark was up by 10.0 %. The MLS® HPI indices represent prices for typical homes with consistent attributes from one period to the next. The fact that the MLS® HPI was up year-over-year by a lesser rate than the average selling price suggests that the share of higher end deals completed in July 2020 was up versus July 2019.
City of Toronto
Toronto average prices rose to $1,017,320 which is 21.1% higher than July of 2019. Total transactions for the month of 3,577 were 15% higher than July of 2019. The increases in price and activity were predominantly driven by the low-rise segment of the market.
The inventory supply remained relatively tight at 1.7 months on hand at the end of July.
Days on market of 16 remained fairly consistent with June.
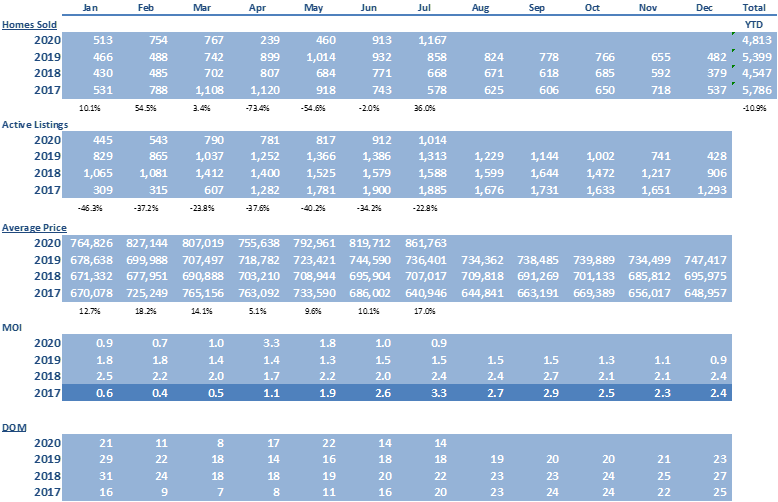
Brampton
Average prices rose to $861,763 which is 17% higher than July of 2019. The price increase experienced across all market segments.
The inventory of 0.9 months on hand at the end of July is among the tightest in the Greater Toronto Area.
Days on market remained consistent with June at 14.
The number of homes trading hands was up a dramatic 36% from July 2019 to 1,167. This was driven primarily by the detached segment, which was up by 49% while condo sales dropped by 14%.
Mississauga
Average prices rose to $905,559 which is a significant (18.5%) increase compared to July of 2019
The inventory supply tightened substantially from June, to 1.3 months on hand at the end of July.
Days on market decreased to 17 in July 2020.
The number of homes trading hands increased by 17.3% from July 2019 to 989. This was driven predominantly by the detached segment, which increased by 46%.
Caledon
Average prices increased to $1,142,430 which is 21.9% higher than July of 2019. This was predominantly driven by the detached segment.
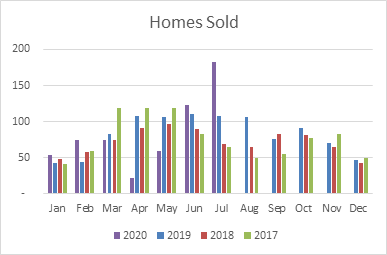
The number of homes trading hands increased by 69.4% from July 2019 to 183. This was also largely driven by the detached segment.
The inventory supply tightened significantly from June to 1.0 months on hand at the end of the month.
Days on market decreased dramatically from the prior month to 22.
Milton
Average prices rose to $842,744 which is 13.7% higher than July of 2019.
The number of homes trading hands rose by a significant 41% from July 2019 to 299. This was driven in large part by the detached segment.
The inventory supply tightened to among the lowest in the GTA at 0.8 months on hand at the end of July.
Days on market decreased to 13.
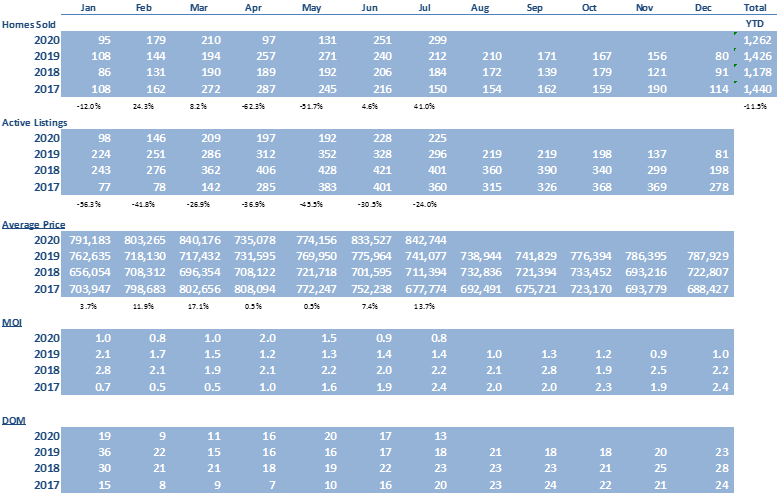
Oakville
The number of homes trading hands increased by 21.7% from July 2019 to 387.
Average prices rose to $1,222,137 which is 13.7% higher than July of 2019.
The inventory supply decreased to 1.7 months on hand at the end of July.
Days on market remained stable at 23.
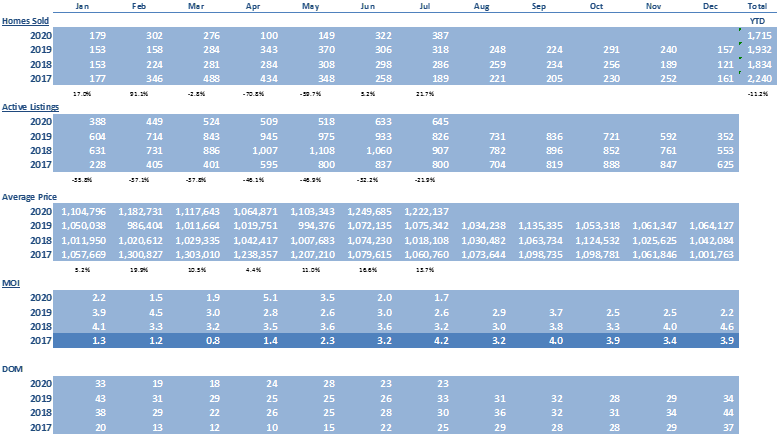
Burlington
Average prices rose to $907,061 which is 12% higher than July of 2019.
The inventory supply tightened to among the lowest in the GTA of 0.9 months on hand at the end of July.
Days on market decreased to 17.
The number of homes trading hands increased by 60.1% from July 2019 to 365.

Georgetown
Average prices increased to $893,960 which is 17.5% higher than July of 2019.
The inventory supply tightened to 0.7 months on hand at the end of July.
Days on market tightened to 16 in July.
The number of homes trading hands rose by 36.1% from July 2019 to 147. This pushed the year-to-date transactions to above the same period in 2019 - the only GTA jurisdiction to do so.
Conclusion
Inventory levels in most parts of the GTA are in very short supply and this is expected to continue for the foreseeable future with prices increasing. Number of transactions should continue at current levels for the short and mid-term as pent up demand will continue to be realized in home sales and accordingly we expect the year to end off at levels similar to last year.
#200 - 10 Kingsbridge Garden Circle
Mississauga, Ontario, L5R 3K6
Office: (905/416) 456-1000
Fax: ( 905) 502-1555
391 Main St. N.
Brampton, Ontario, L6X 1N7
Office: (905/416) 456-1000
Fax: (905) 456-8116
295 Queen St. E.
Brampton, Ontario, L6W 3R1
Office: (905/416) 456-1000
Fax: (905) 456-1924
#209 - 164 Sandalwood Pky. E.
Brampton, Ontario, L6Z 3S4
Office: (905/416) 456-1000
Fax: (905) 840-2344
New Listings
Open Houses
Homes For Lease
The RE/MAX Collection
Commerical Properties
Neighbourhood Watcher™
Neighbourhood Solds
Preferred Client Registration
Find My Dream Home
What's My Home Worth?
Mortgage Pre-Approval
Mortgage Calculator
Land Transfer Tax
The information contained on this site is based in whole or in part on information that is provided by members of The Canadian Real Estate Association, who are responsible for its accuracy. CREA reproduces and distributes this information as a service for its members and assumes no responsibility for its accuracy.
This website is operated by a brokerage or salesperson who is a member of The Canadian Real Estate Association.
The listing content on this website is protected by copyright and other laws, and is intended solely for the private, non-commercial use by individuals. Any other reproduction, distribution or use of the content, in whole or in part, is specifically forbidden. The prohibited uses include commercial use, "screen scraping", "database scraping", and any other activity intended to collect, store, reorganize or manipulate data on the pages produced by or displayed on this website.