MONTHS OF INVENTORY DROP, SALES ACTIVITY RECOVERS
May 10, 2019 Real Estate

TREB analysts successfully contributed to the government discussions regarding stress test revisions and we will see the results of those discussions later on this year.
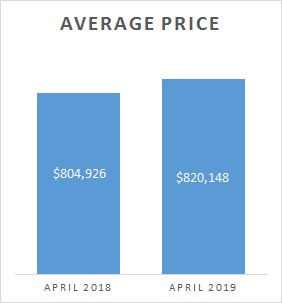
We continue to see buyer competition between listings due to low inventory. These tight conditions are enough to maintain adequate price growth, keeping the market stable. Some more considerable increases for the month of April are more likely to be a catch up period reflective of the slow first quarter, than indicative of rises throughout the remainder of the year.
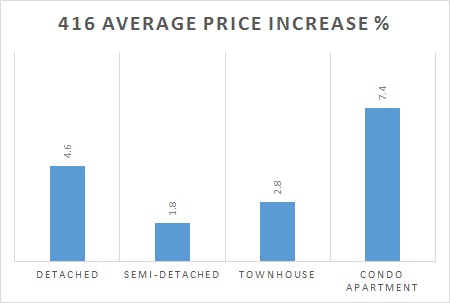
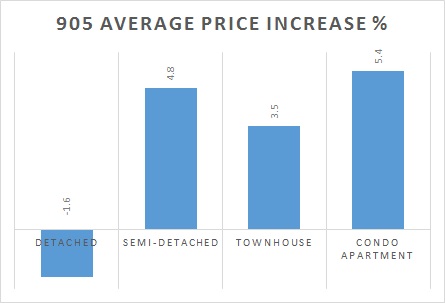
Again, we see there’s considerably disparity between the 905 and 416 regions regarding pricing averages. Semi-detached prices are being pushed up in the 905 due to demand and low inventory pushing potential owners farther out from the core of the GTA.
Condos, apartments, and townhouses continue to drive the market for the most part as the rate of sales for detached homes in the surrounding area of Toronto have seen a dip in result of the stress test impact.
 |
 |
Month by month, sales are still steadily increasing (16.8%). Days on Market (19) and Months of Inventory (2.0) have reduced which further support the strengthening market conditions. The progressions begin to push us into a buyers market.
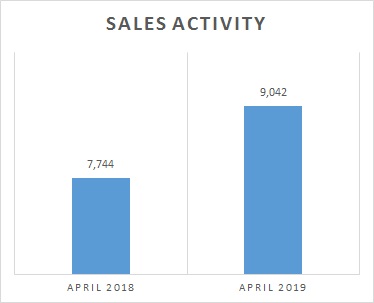
New listings are up year over year by 8%, and though that has not yet kept up with the other statistical market adjustments, the market conditions remain tight, pushing prices up and motivating sales.
Brampton
 |
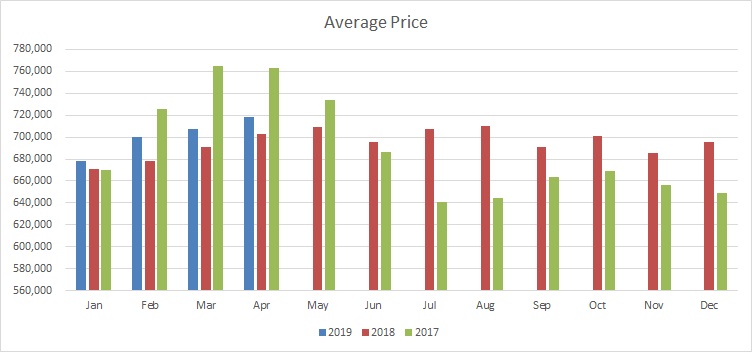 |
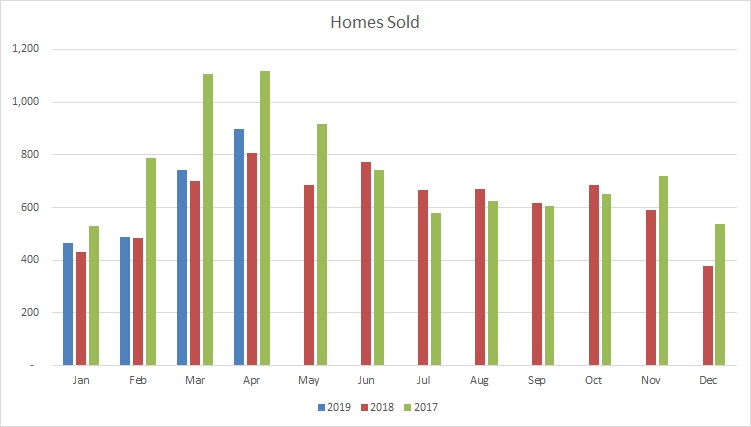
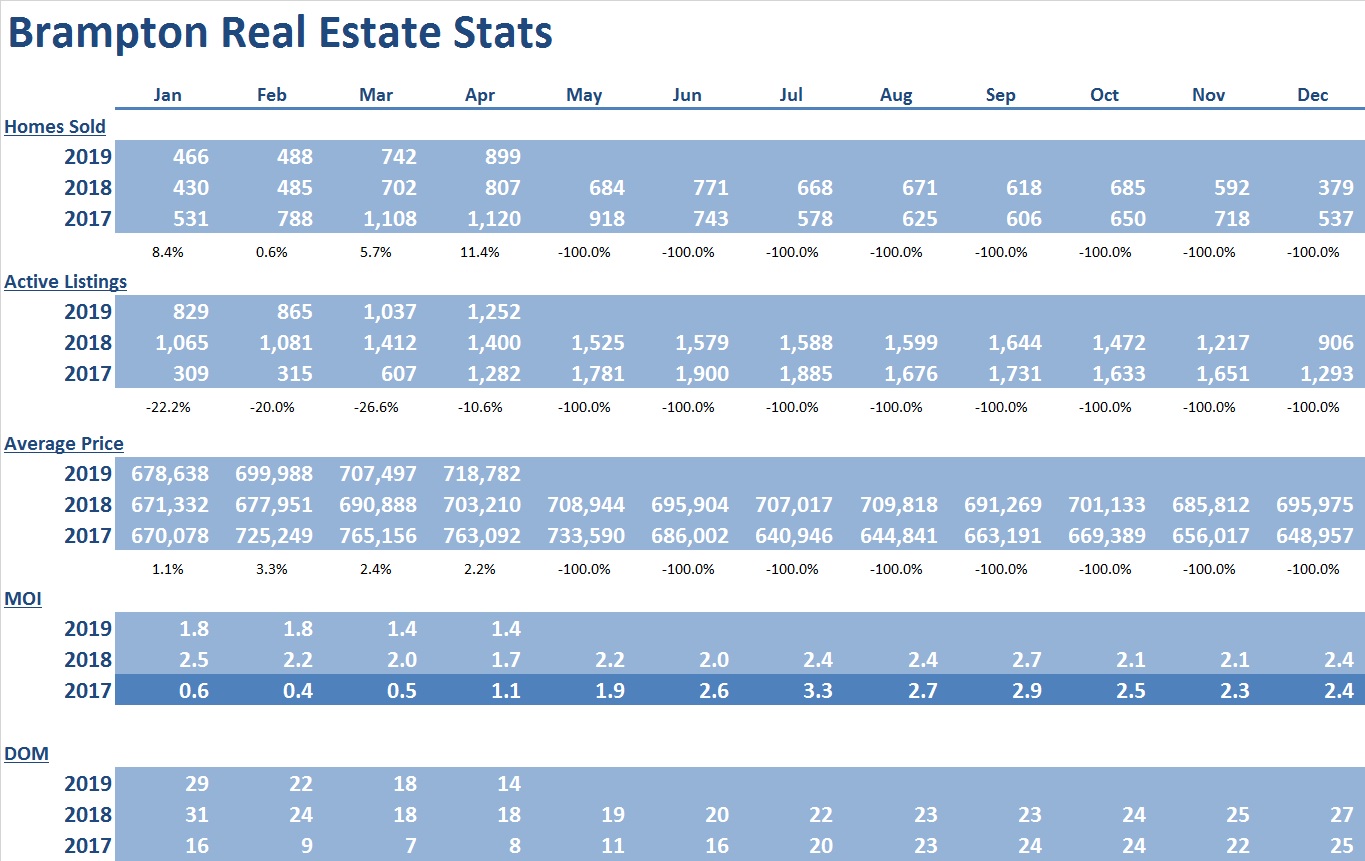
Brampton sales activity and prices continue to increase across all housing types. Homes sold increases climb steadily, but with a slight dip for the townhouse market—likely impacted by the rise of the condo boom.
Months of inventory are holding steady (reduced from last year), but with the Days on Market have reduced to 14. This is an improvement from last month as well as last year. Tight supply will continue to maintain upward pressure on average prices moving forward.
Mississauga
 |
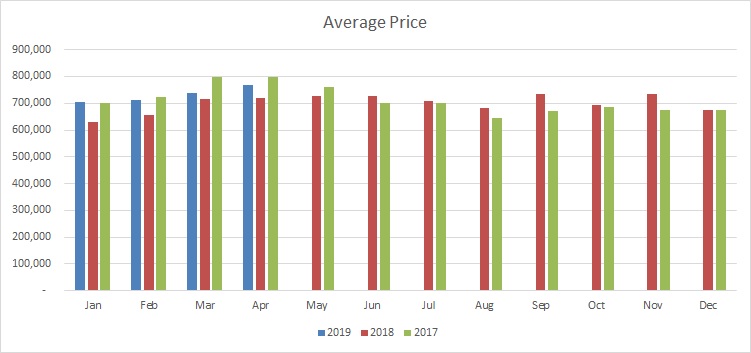 |
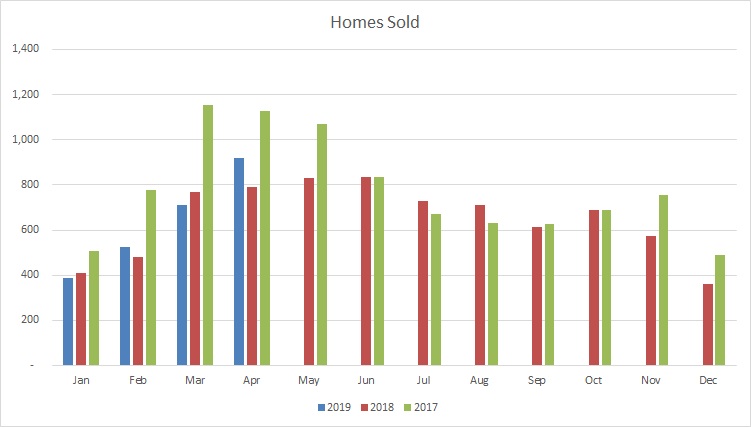
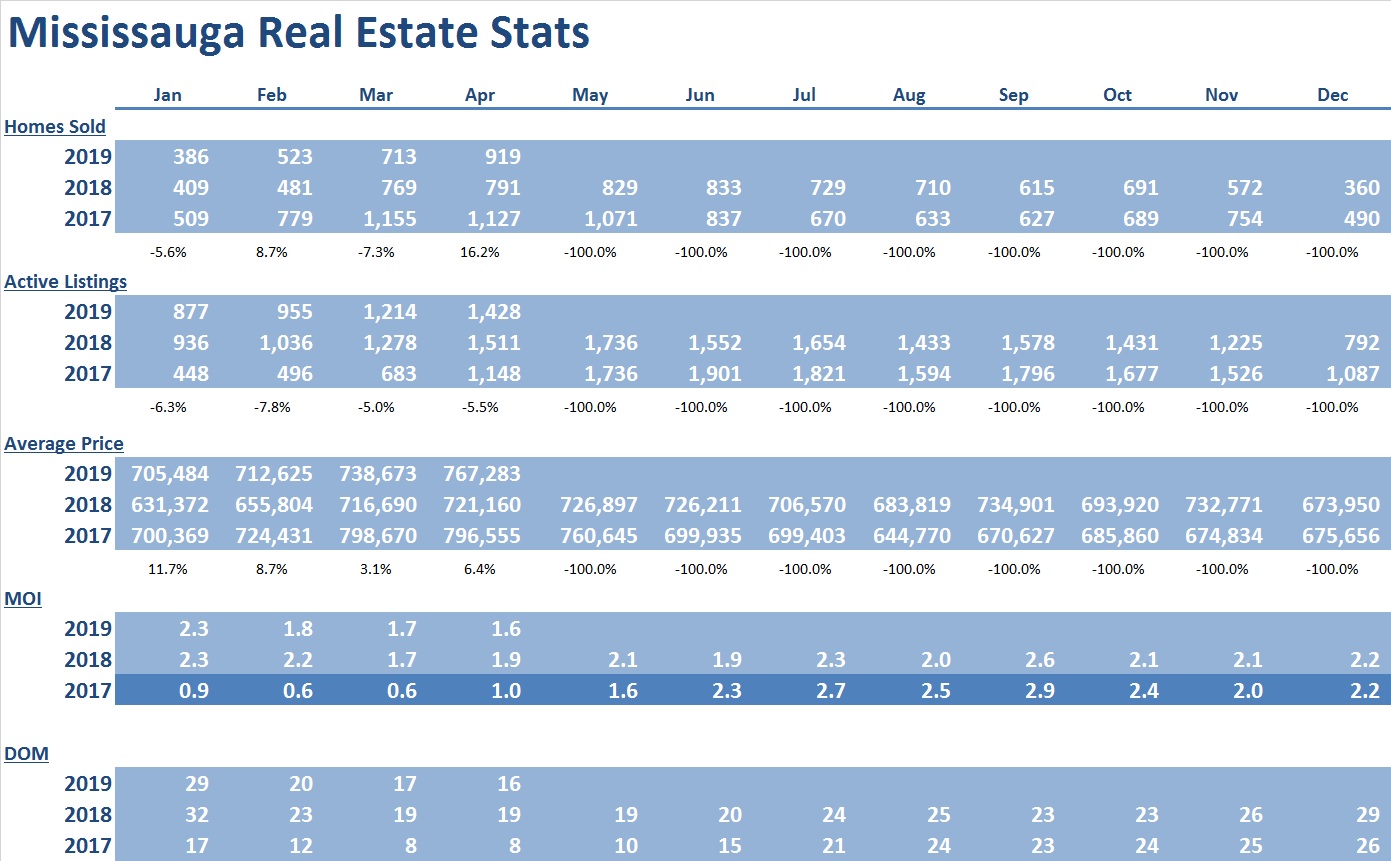
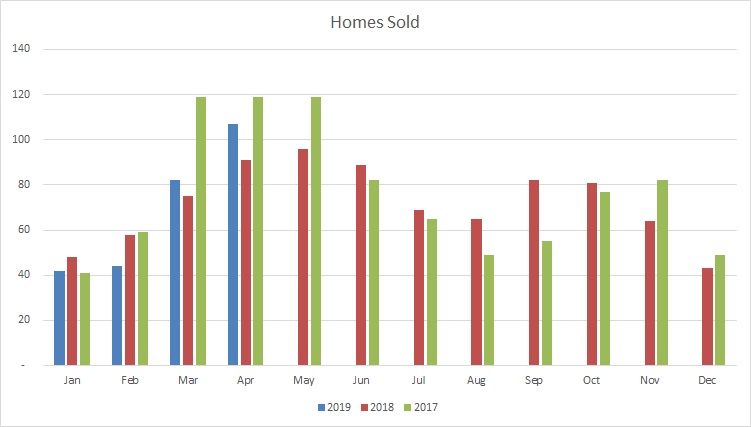
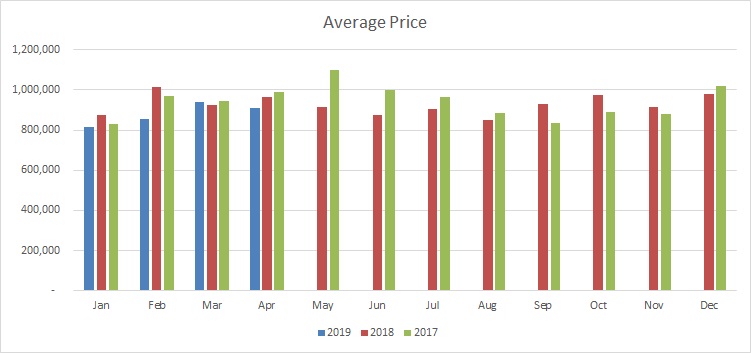
The Mississauga market is stable with increases in homes sold in all housing types as well as price increases (lead by condos at 10.2% above last year).
Months of Inventory (1.6) and Days on Market (16) continue to tighten and strengthen the market as improved from last months numbers as well as last year around this time.
Caledon
 |
 |
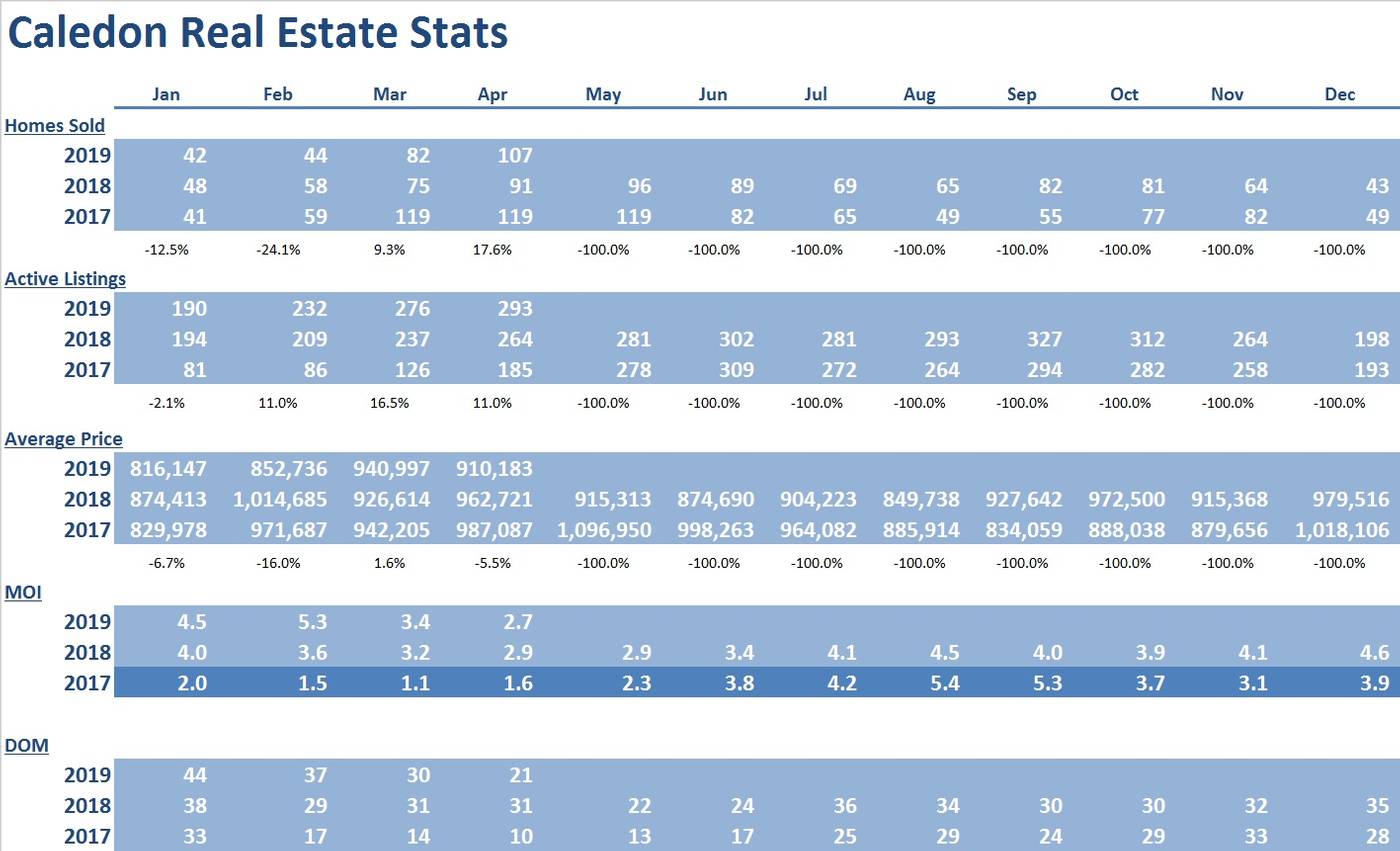
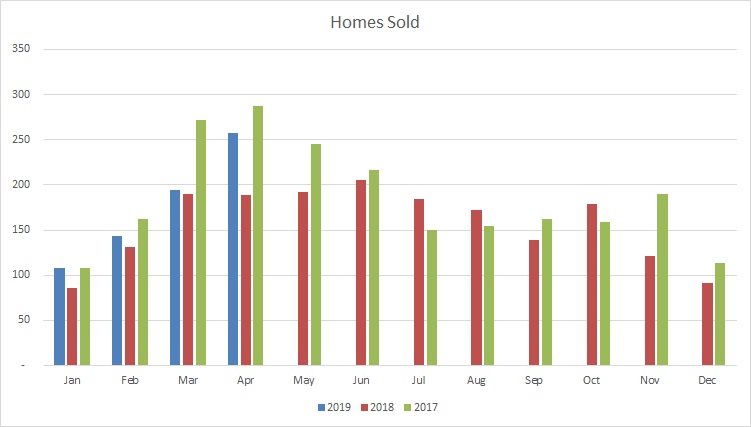
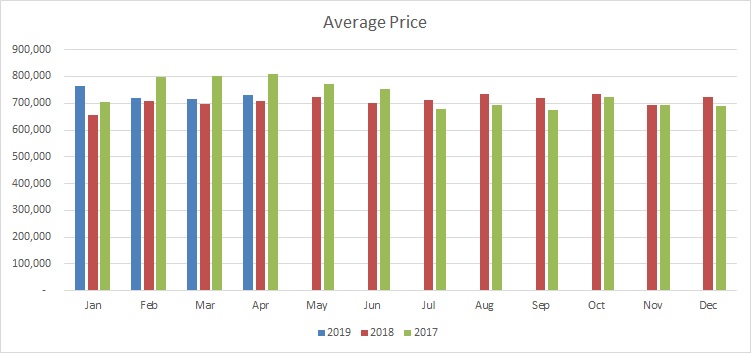
Number of homes sold is picking up in Caledon as average prices for detached and semi-detached homes see a slight decrease.
Average price of $910,183 is mostly a reflection of the mix of homes traded rather than the trend of where prices are headed.
Supply adjusted to 2.7 months of inventory. As there are very few homes traded in Caledon a clearer picture of the market trajectory will appear as we get further into the year.
Days on market of 21 is a welcome improvement to both last month and last year.
Milton
 |
 |
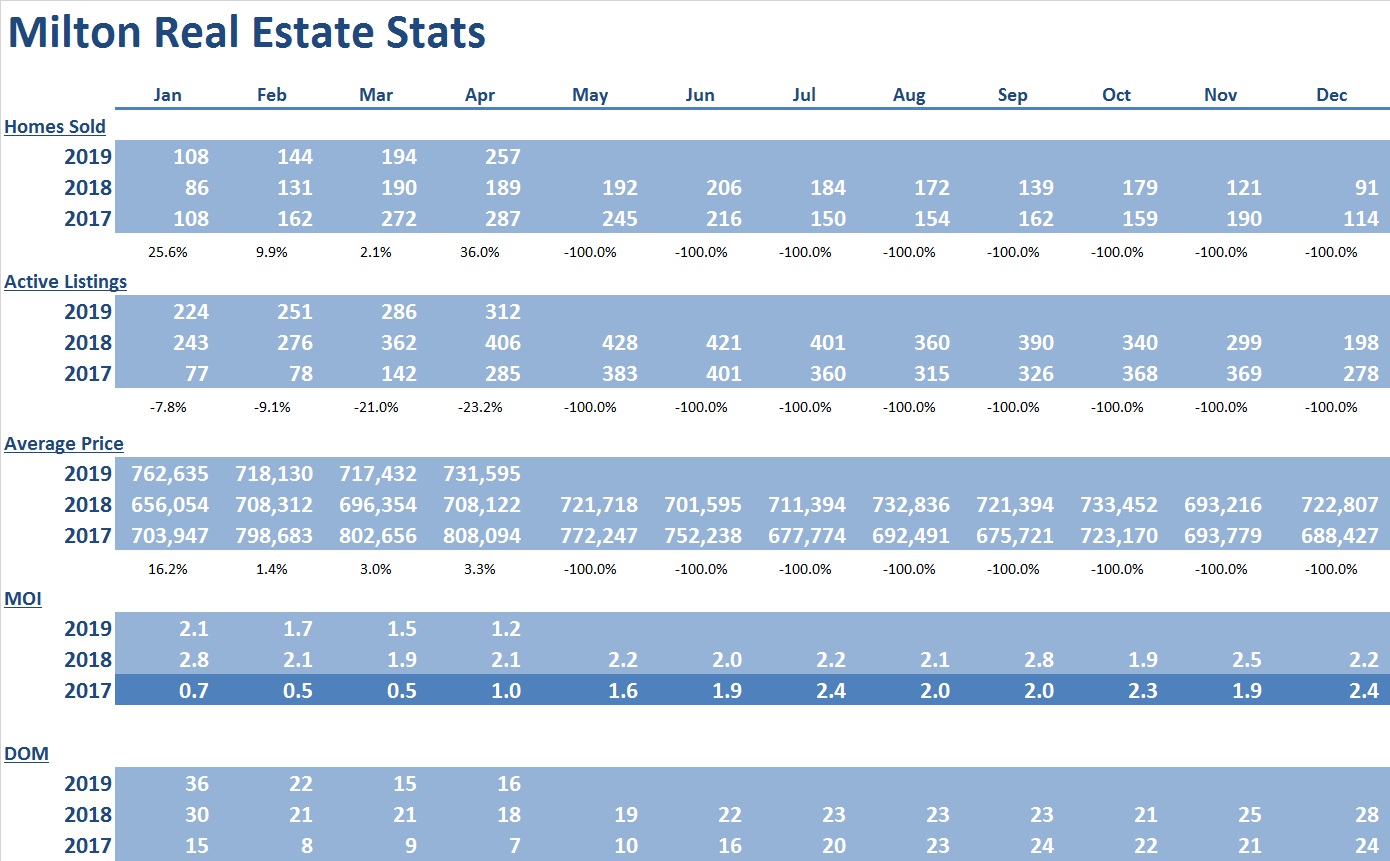
Milton market maintains its climbing sales numbers. Prices also continue to hold steady. Homes sold is up by 36% and prices overall show a reasonable increase of 3.3%.
Supply tightened to 1.2 months of inventory. Days on market remain steady with only a single day increase (16) from last month (15), which is an improvement from last year’s 18.
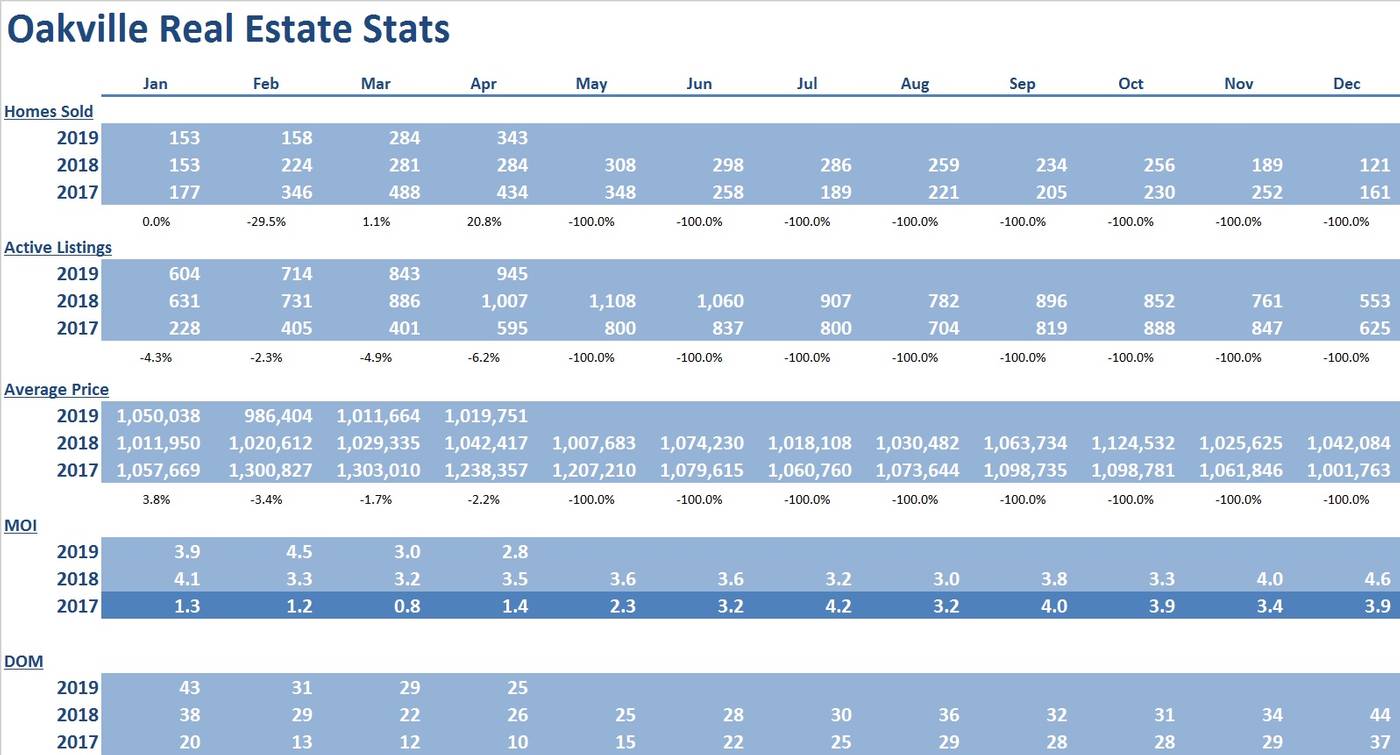
Oakville
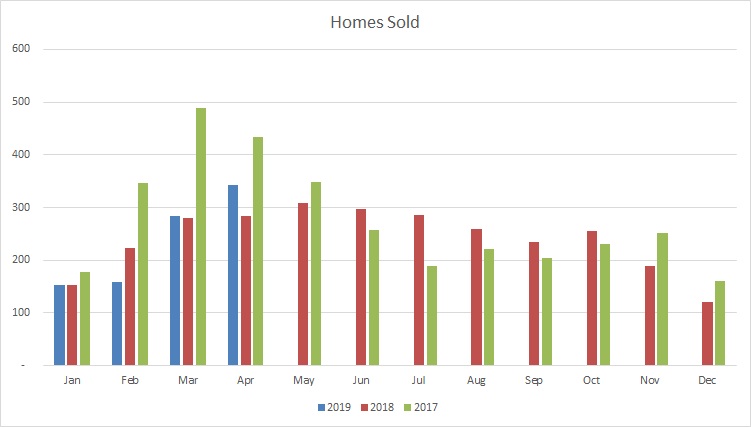 |
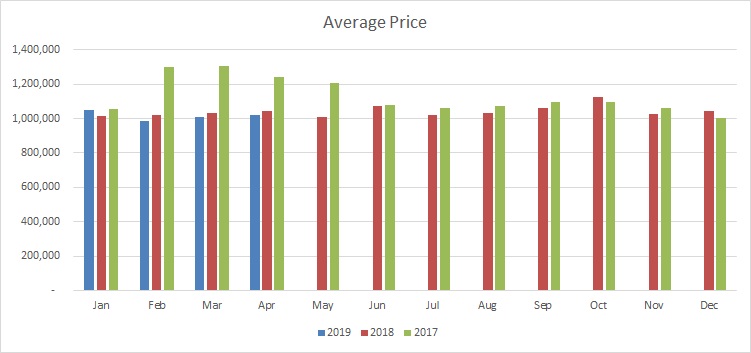 |
Prices maintain slight underperformance from the previous year (2.2%), but this has encouraged a spike in homes sold (20.8%).
Months of inventory reduces to 2.8. Days on market (25) improved from last month (29) and compare favourably with last year (26).
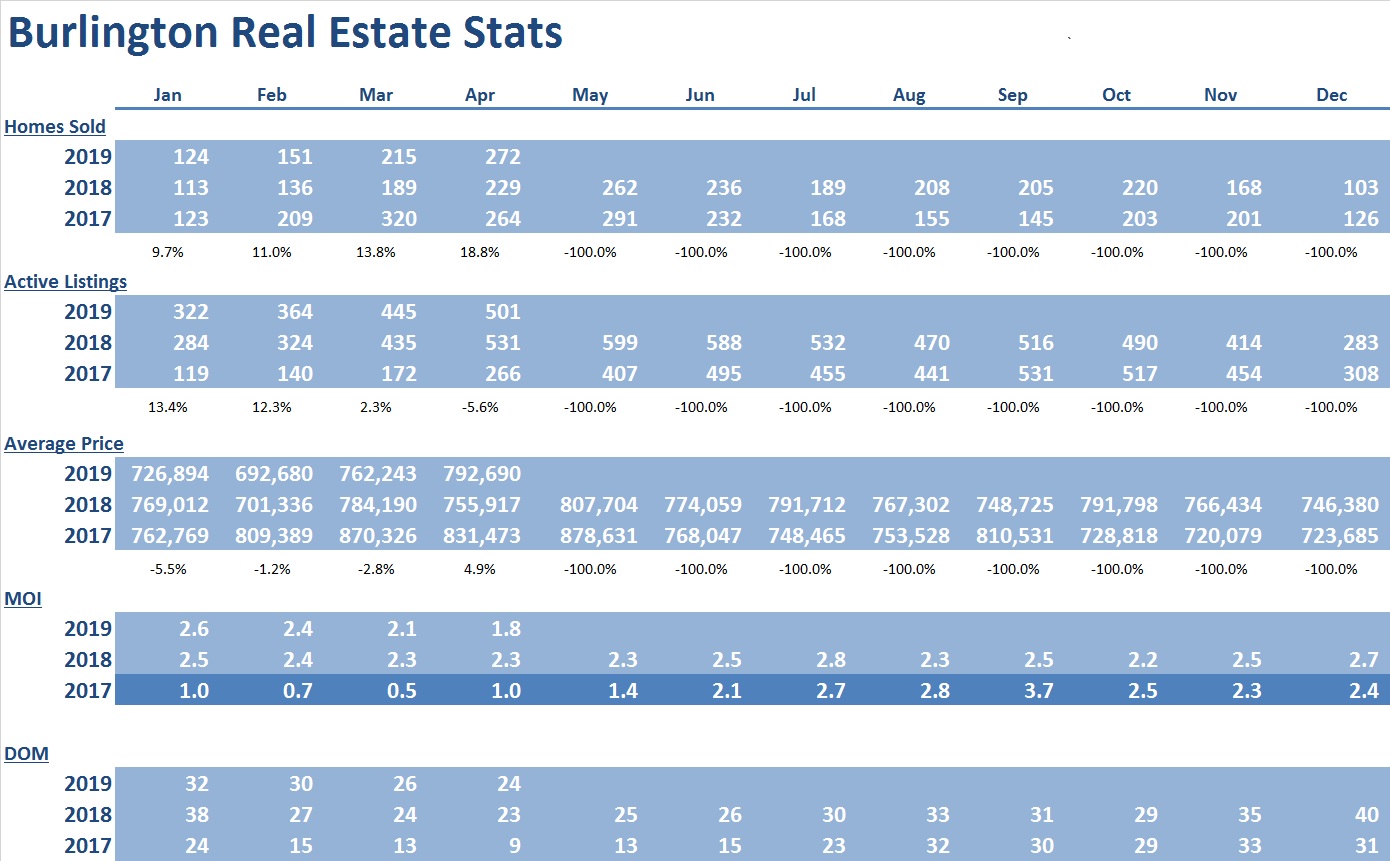
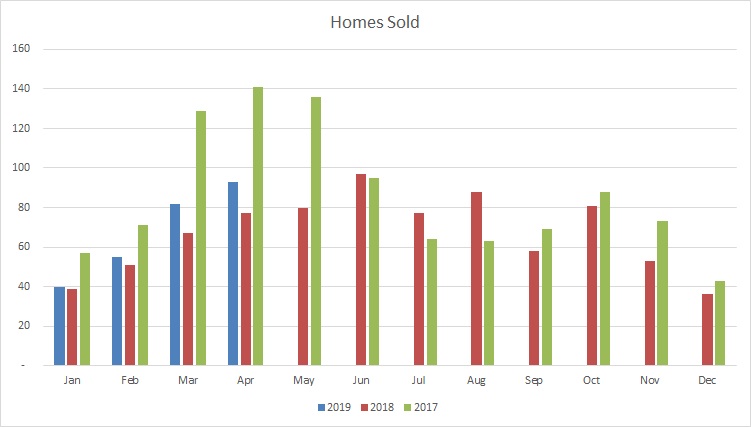
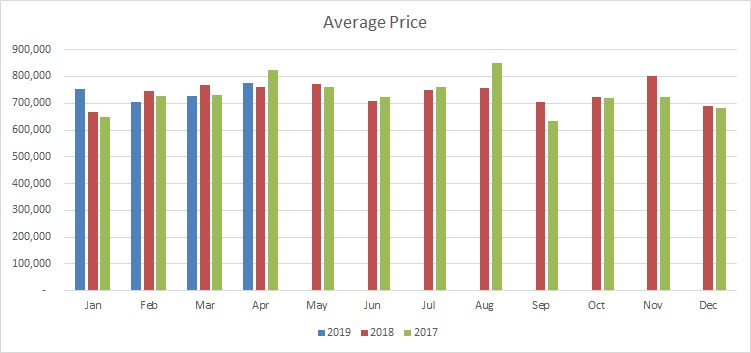
Burlington
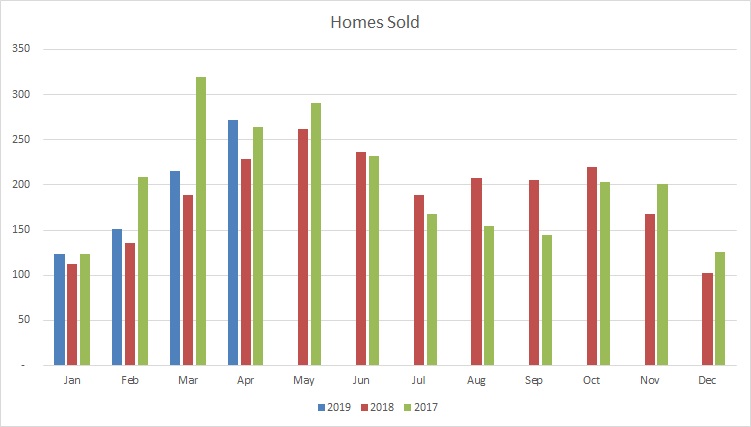 |
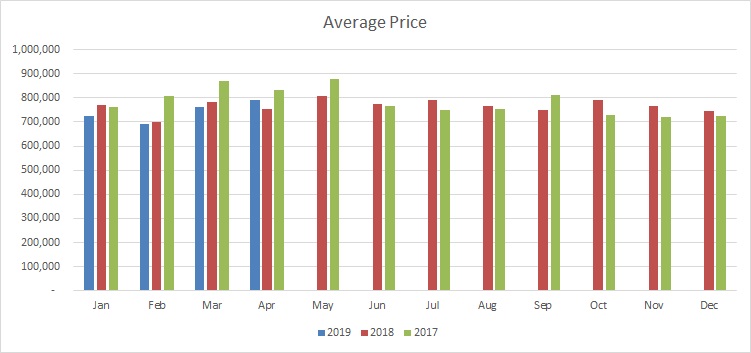 |
The number of homes sold in Burlington continue to climb (up 19% from last year).
Prices increase a moderate amount (4.9%). Driven mostly by semi-detached and condo properties.
Supply tightened to 1.8 months of inventory on hand. This tight supply should put upward pressure on prices moving forward.
Days on market have improved to 24 which shows stability compared to last year’s 23.
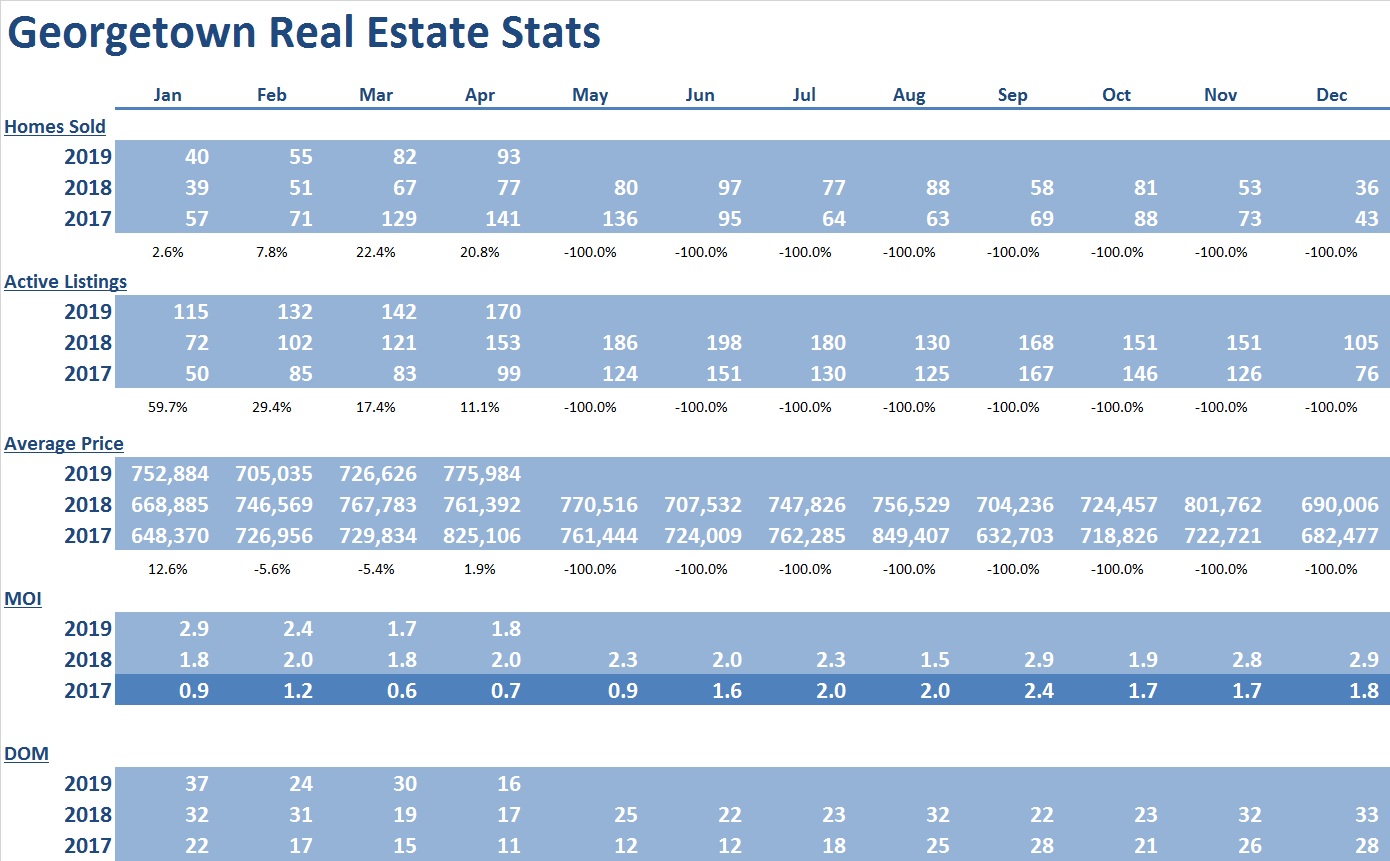
Georgetown
 |
 |
As there are very few homes traded in Georgetown, and a clearer picture of the real estate market will appear as we get further into the year.
Average prices are leveling out with a modest increase of 1.9% from last year.
Months of inventory hold steady at 1.8.
Days on market of 16 improved considerably from last month (30) and is comparative to last years number (17).
Conclusion
The 5% overall price increase is healthy considering the after shock of the implementation of the foreign tax credit and the mortgage stress test. We expect the MOI to remain stable throughout the year without drastic change, hovering around the three month mark.
It should be noted that we’ve reached the strongest annual rate of growth in 2019 so far.
Upward pressure on home prices in the GTA will continue as available housing in most parts of the GTA remains in a short supply.
*Some Key Economic indicators for a healthy real estate forecast:
Mississauga Market Showing Signs of Improvement: https://www.insauga.com/demand-increases-for-houses-in-mississauga
Mississauga Ranked One of the Best Places to Live in Canada: https://www.insauga.com/mississauga-ranked-one-of-the-best-places-to-live-in-canada
Bank of Canada Recommends More Flexibility in Mortgage Terms: https://www.bankofcanada.ca/2019/05/canadas-mortgage-market-evolve-offer-more-choice/
StatCan Labour Survey- Employment Rates Are Up: https://www150.statcan.gc.ca/n1/daily-quotidien/190510/dq190510a-eng.htm?HPA=1
Competition for affordable homes among millennials, international migrants, and downsizing baby boomers is spurring residential investment: https://www.livabl.com/2019/05/millennials-migrants-surging-demand-canadian-condos.html
#200 - 10 Kingsbridge Garden Circle
Mississauga, Ontario, L5R 3K6
Office: (905/416) 456-1000
Fax: ( 905) 502-1555
391 Main St. N.
Brampton, Ontario, L6X 1N7
Office: (905/416) 456-1000
Fax: (905) 456-8116
295 Queen St. E.
Brampton, Ontario, L6W 3R1
Office: (905/416) 456-1000
Fax: (905) 456-1924
#209 - 164 Sandalwood Pky. E.
Brampton, Ontario, L6Z 3S4
Office: (905/416) 456-1000
Fax: (905) 840-2344
New Listings
Open Houses
Homes For Lease
The RE/MAX Collection
Commerical Properties
Neighbourhood Watcher™
Neighbourhood Solds
Preferred Client Registration
Find My Dream Home
What's My Home Worth?
Mortgage Pre-Approval
Mortgage Calculator
Land Transfer Tax
The information contained on this site is based in whole or in part on information that is provided by members of The Canadian Real Estate Association, who are responsible for its accuracy. CREA reproduces and distributes this information as a service for its members and assumes no responsibility for its accuracy.
This website is operated by a brokerage or salesperson who is a member of The Canadian Real Estate Association.
The listing content on this website is protected by copyright and other laws, and is intended solely for the private, non-commercial use by individuals. Any other reproduction, distribution or use of the content, in whole or in part, is specifically forbidden. The prohibited uses include commercial use, "screen scraping", "database scraping", and any other activity intended to collect, store, reorganize or manipulate data on the pages produced by or displayed on this website.