March Market Update 2020
April 3, 2020 Announcements
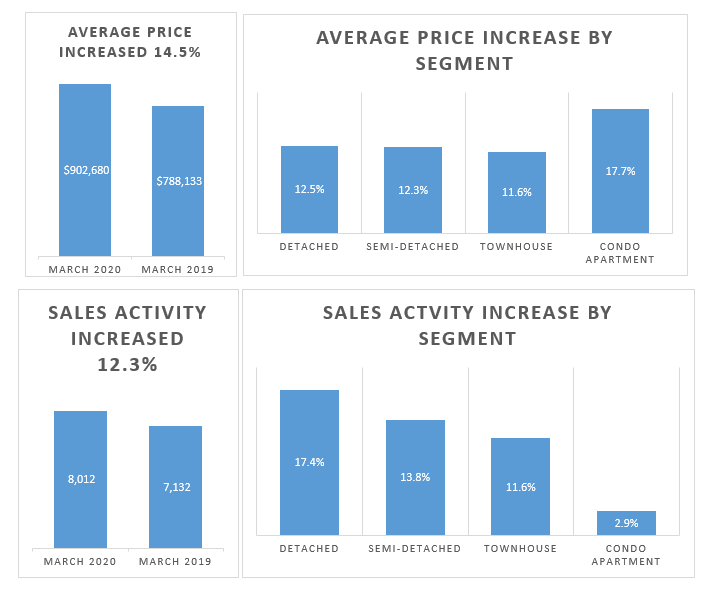
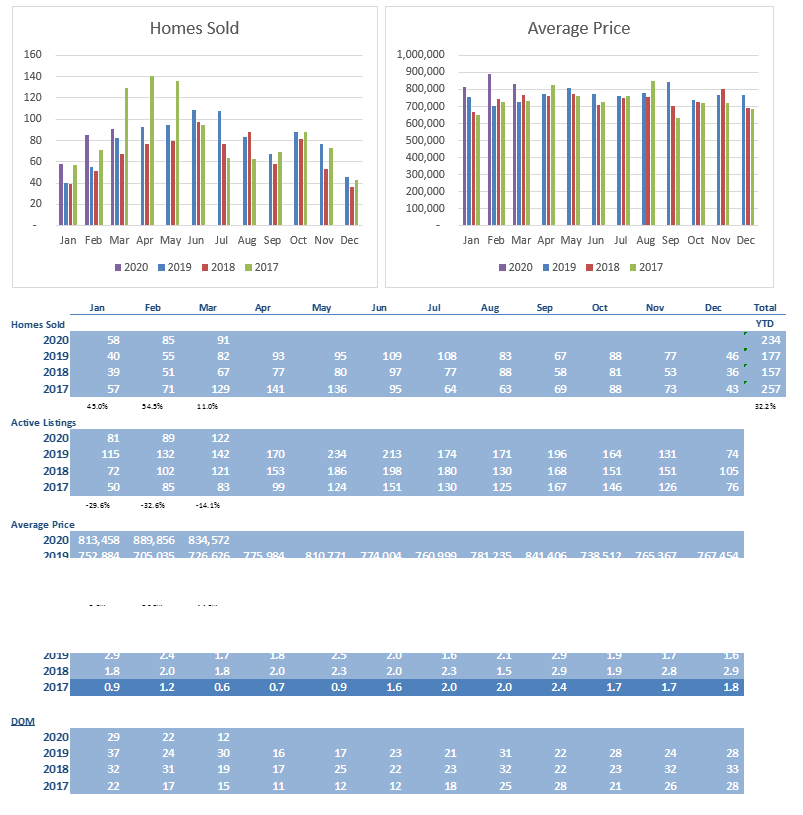
Prices remain stable in March as inventory continues to be in short supply
For the Greater Toronto Area (GTA), the average home price of $902,680 is up 14.5% from March of 2019. The average price is down just under one percent from February 2020 when average price was $910,273.
8,012 homes traded hands and represents an increase of 12.5% from March 2019. This increase should be prefaced with an explanation; the high activity of the first two weeks of March 2020 represented an increase of 49% compared to the first 14 days of March 2019, while the second half activity was actually down by 15.9% over the same period in March 2019.
We are expecting inventory to remain in short supply for the foreseeable future and as such, prices should remain stable.
We could continue to see a softening of the number of transactions until there is a resolution to COVID 19.
Anecdotally, it appears that the buyers who have put the brakes on their buying decision, have by and large, put their buying decision on a temporary hold and are expected to return upon resolution of COVID 19 and accordingly we expect a bounce back in number of homes changing hands.
At the end of March, only 1.3 months of inventory were available for sale. Industry insiders view anything under 4 months as tight supply and a sellers’ market, 4 to 6 months as balanced market and above 6 as a buyers’ market. As such, during March, we were in a sellers’ market.
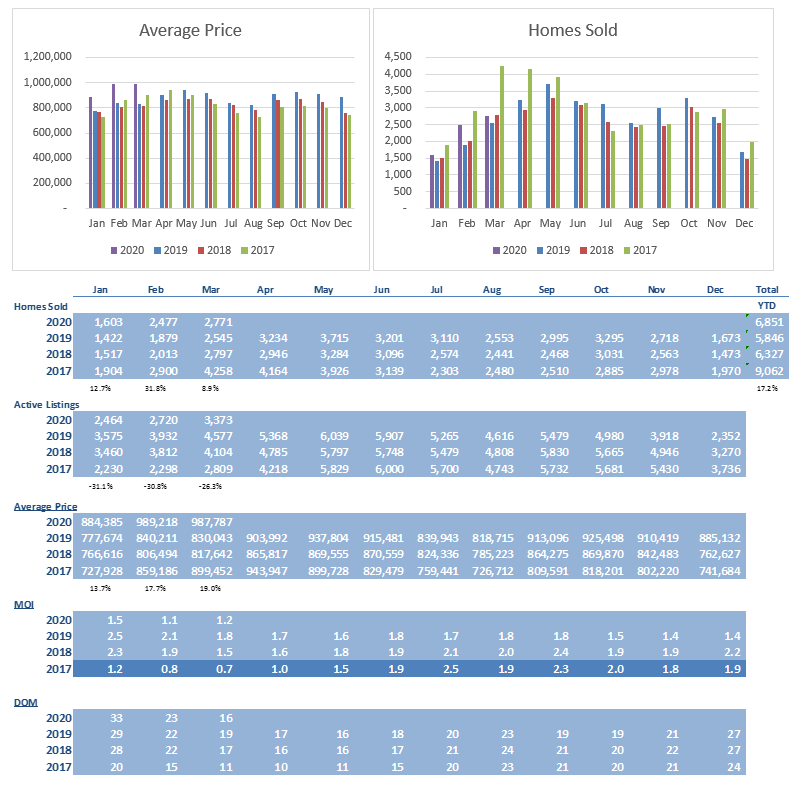
City of Toronto
Toronto prices rose to $987,787 which is up 19.0% over March of 2019 and down slightly from the high this year which occurred in February 2020 of $989,218. This was driven by the tight supply of 1.2 months.
Days on market improved to 16. The number of homes trading hands rose 8.9% (to 2,771) over March 2019.
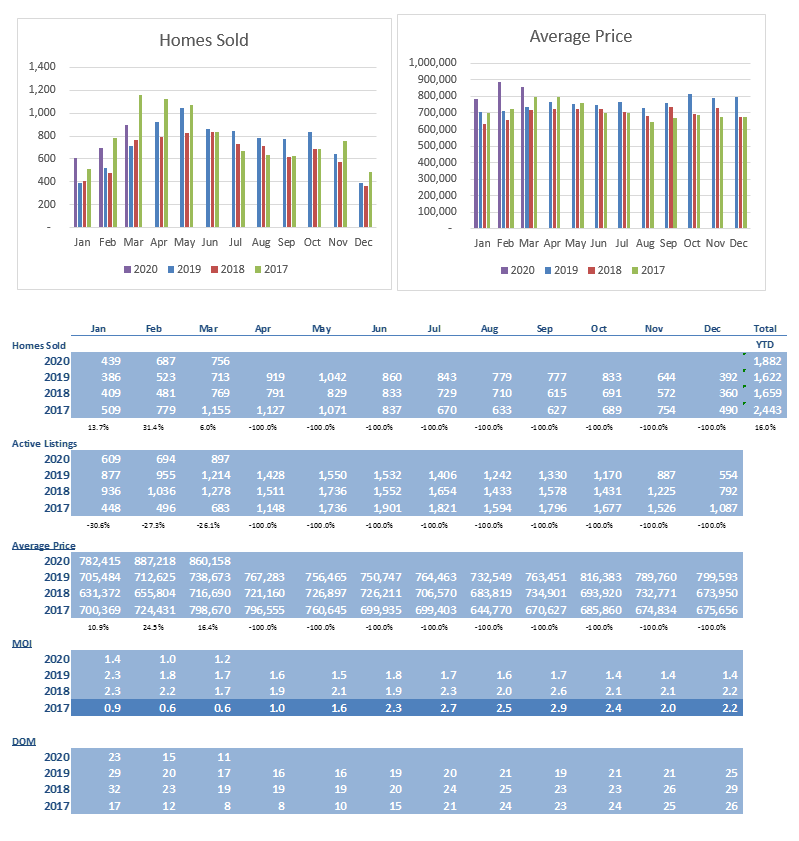
Brampton
Prices rose to $807,019 which is up 18.2% over March of 2019, but down 2.4% from the high for the year of $827,144 reached in February 2020. There were 767 homes sold in March which represented an increase of 3.4% over March 2019. Inventory remained tight at 1.1 months on hand at the end of March.
Days on market have improved dramatically to 8 from 18 at the same time a year ago.
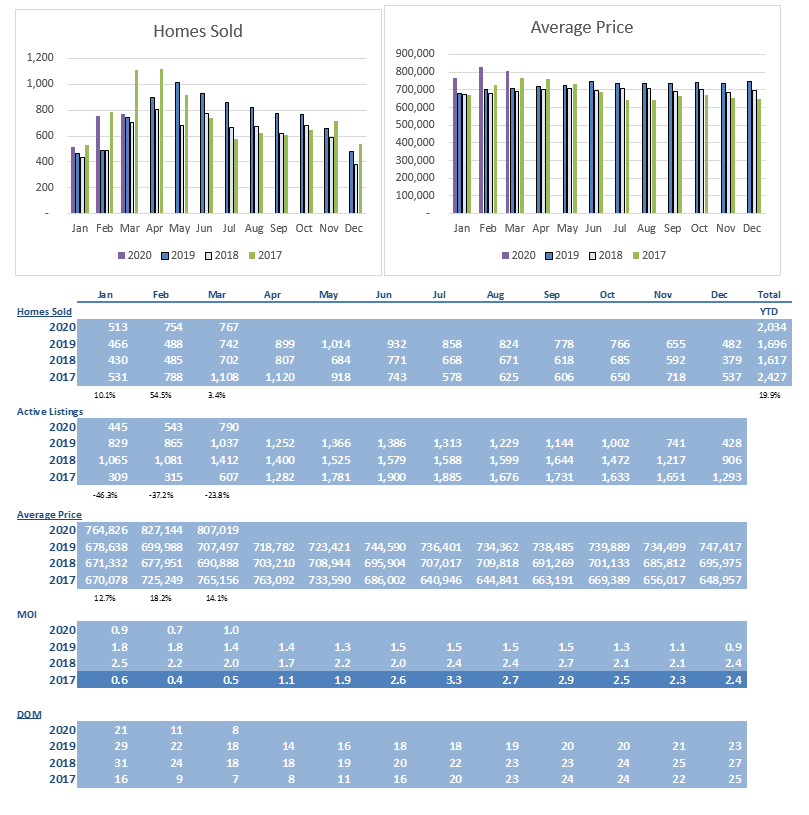
Mississauga
Average prices increased 16.4% over March 2019 to $860,158. Prices were down by 3.0% from the high for the year reached in February 2020 of $887,218. Number of homes sold of 756 represented an increase by 6.0% compared to March of 2019.
Inventory at the end of March remained low at 1.2 months on hand.
Days on market for the month of 11 was a noticeable improvement over March of 2019 value of 17 days.
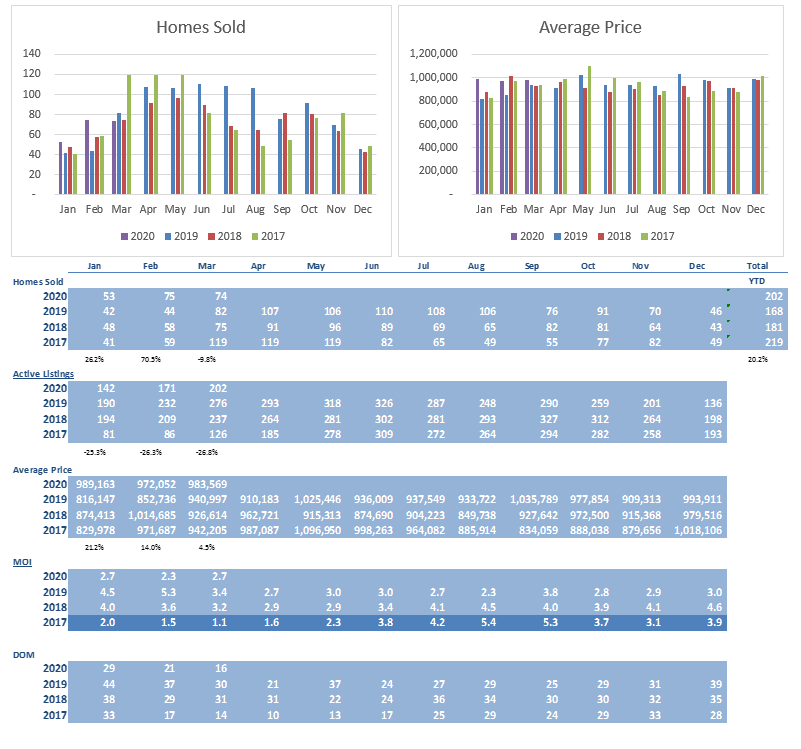
Caledon
Average price of $983,569 increased 4.5% from the same time last year. 74 homes traded hands and represented a drop of 9.8% from March 2019.
Days on market of 16 improved significantly from the 30 days on market experienced during March 2019.
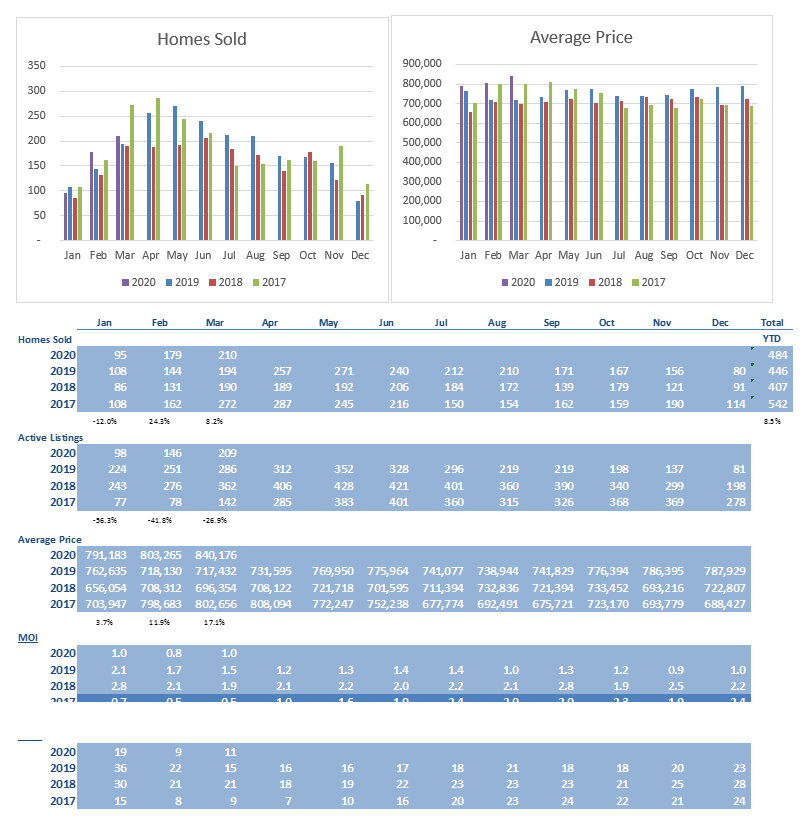
Milton
Average price of $840,176 was up 17.1% over March 2019. Activity for the month of 210 homes was up 8.2% compared to March of 2019.
There was only 1.0 month of inventory on hand.
Days on market improved to 11 from 15 experienced in March 2019.
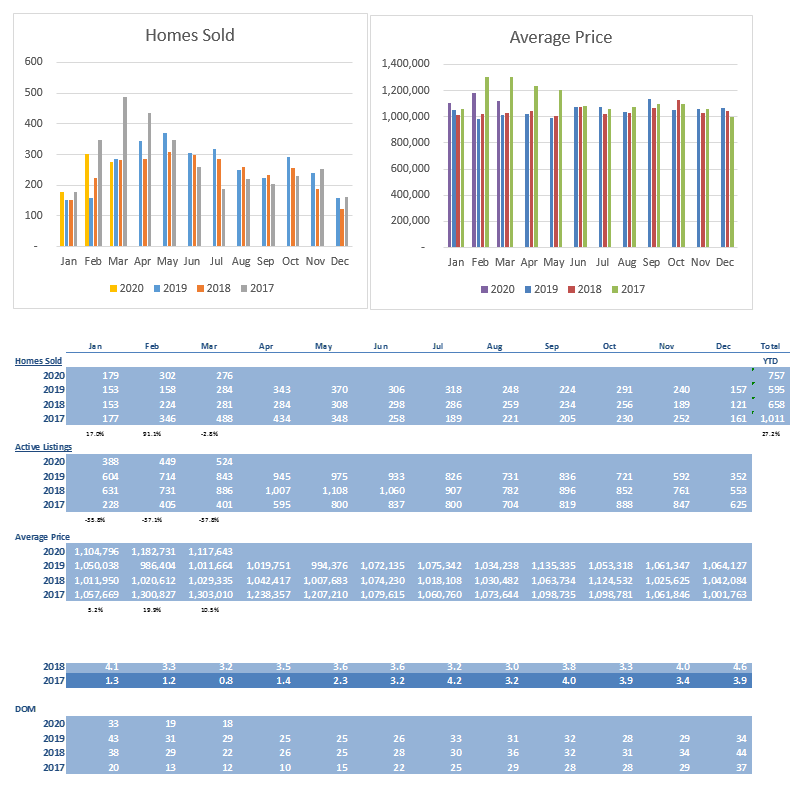
Oakville
The Oakville average price of $1,117,643 is up 10.5% from March 2019.
Year over year sales are down 2.8% to 276 homes.
Supply tightened to 1.9 months of inventory on hand from 3.0 months at the end of March 2019.
Days on market improved to 18 from 29 during March 2019.
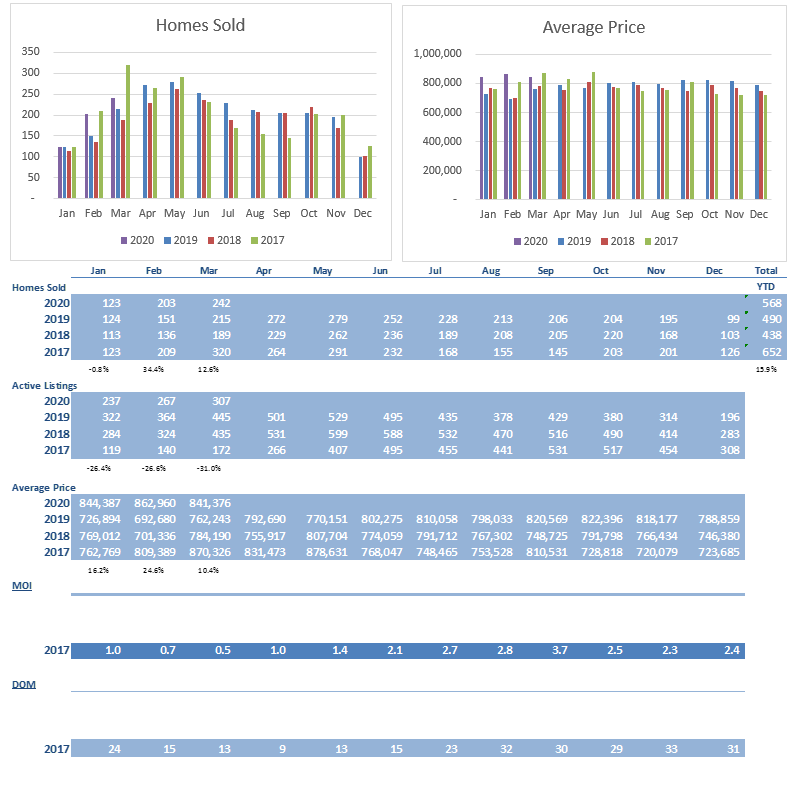
Burlington
Prices rose 10.4 to $841,376 compared to March 2019.
March sales Increased by 12.6% from the same time last year to 242 homes.
Supply tightened to 1.3 months of inventory on hand compared to 2.1 for the same period in 2019.
Days on market have improved to 11 from 26 at the same time last year.
Georgetown
Average price in March 2020 of $834,572 is up 14.9% from March 2019. Number of transactions is up 11.0% to 91 homes over the same period.
Supply was at 1.3 months of inventory on hand.
Days on market improved to 12 from 30 during the same time last year.
Conclusion
We are expecting inventory to remain in short supply for the foreseeable future and as such, prices should remain stable, while the number of transactions should moderate until the COVID 19 pandemic is resolved.
*Some Key Economic indicators for a healthy real estate forecast:
Peel Region expected to grow by 500,000 people in next 2 decades https://www.insauga.com/500000-new-residents-expected-in-mississauga-and-surrounding-cities-over-next-two-decades
BOC reduces interest rates in March https://www.bankofcanada.ca/2020/03/press-release-2020-03-27/
Key economic indicators – Statistics Canada https://www.statcan.gc.ca/eng/start
Consumer confidence index https://www.conference-board.org/data/consumerconfidence.cfm
#200 - 10 Kingsbridge Garden Circle
Mississauga, Ontario, L5R 3K6
Office: (905/416) 456-1000
Fax: ( 905) 502-1555
391 Main St. N.
Brampton, Ontario, L6X 1N7
Office: (905/416) 456-1000
Fax: (905) 456-8116
295 Queen St. E.
Brampton, Ontario, L6W 3R1
Office: (905/416) 456-1000
Fax: (905) 456-1924
#209 - 164 Sandalwood Pky. E.
Brampton, Ontario, L6Z 3S4
Office: (905/416) 456-1000
Fax: (905) 840-2344
New Listings
Open Houses
Homes For Lease
The RE/MAX Collection
Commerical Properties
Neighbourhood Watcher™
Neighbourhood Solds
Preferred Client Registration
Find My Dream Home
What's My Home Worth?
Mortgage Pre-Approval
Mortgage Calculator
Land Transfer Tax
The information contained on this site is based in whole or in part on information that is provided by members of The Canadian Real Estate Association, who are responsible for its accuracy. CREA reproduces and distributes this information as a service for its members and assumes no responsibility for its accuracy.
This website is operated by a brokerage or salesperson who is a member of The Canadian Real Estate Association.
The listing content on this website is protected by copyright and other laws, and is intended solely for the private, non-commercial use by individuals. Any other reproduction, distribution or use of the content, in whole or in part, is specifically forbidden. The prohibited uses include commercial use, "screen scraping", "database scraping", and any other activity intended to collect, store, reorganize or manipulate data on the pages produced by or displayed on this website.