February Market Update 2020
March 6, 2020 Announcements
After a very strong February for prices and homes sold, the number of transactions in March could moderate
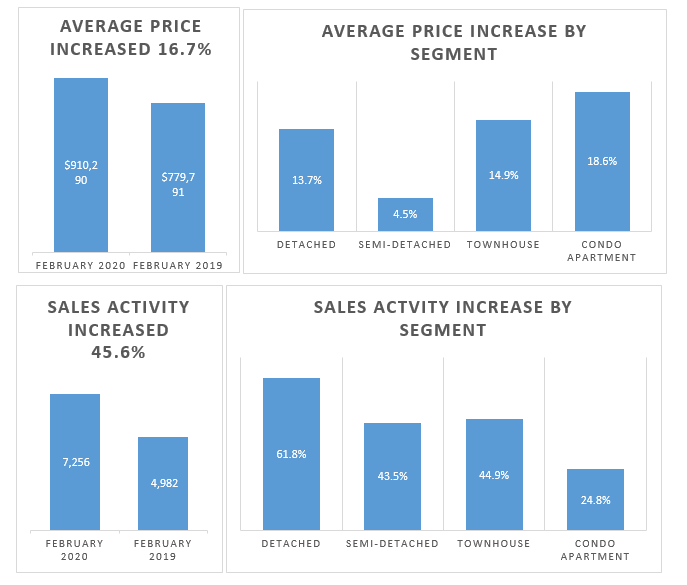
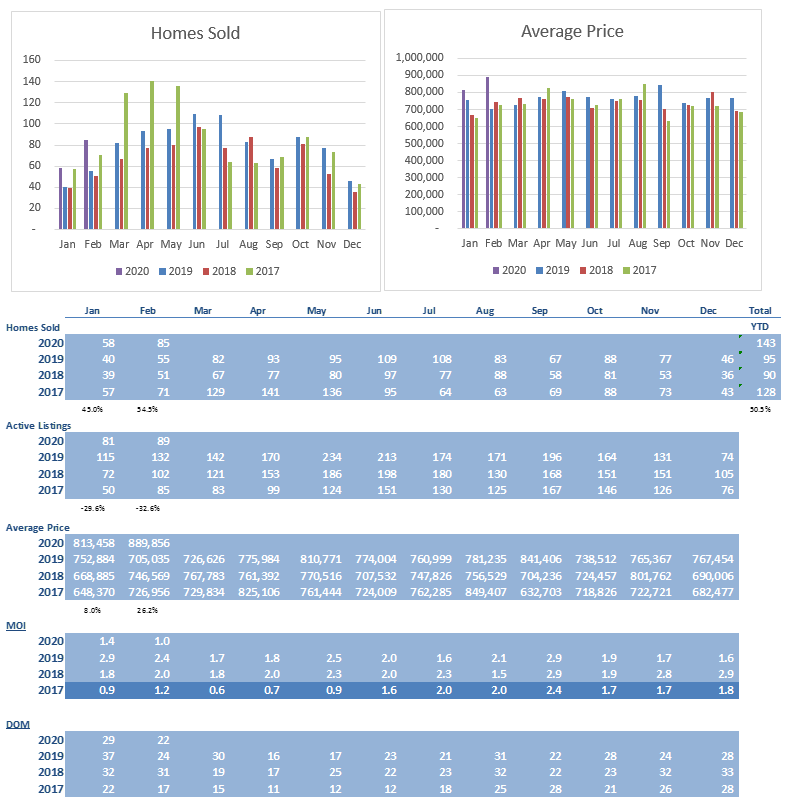
The real estate market in the Greater Toronto Area (GTA) continued to strengthen in February. Strong sales up against a constrained supply resulted in an accelerating rate of price growth as many properties continued to see multiple offers.
Average price reported through TREB’s MLS® System by GTA REALTORS® increased by 16.7% to $910,290 and residential sales were up by a dramatic 45.6% year-over-year to 7,256. There was a significant jump in prices in February alone as average prices increased by 8.5% from January of 2020.
While sales were up substantially, the number of new listings entered into TREB’s MLS® System were up 7.9 per cent year-over-year. As a result, at the end of February, only 1.2 months of inventory were available for sale. Industry insiders view anything under 4 months as tight supply and a sellers’ market, 4 to 6 months as balanced market and above 6 as a buyers’ market. As such, we are deep into a sellers’ market.
During the writing of this report, the market had 4 forces; on the one hand, the COVID 19 virus is having a moderating effect, spring break is a “staycation” this year, continued shortage of inventory, and the 1% decrease in the overnight lending rate by the Bank of Canada. All causing concerns and excitement all at the same time. Overall, we conclude that the market will moderate somewhat for numbers of homes trading hands in the short run, however the scarce inventory and lower interest rates will continue to put upward pressure on prices.
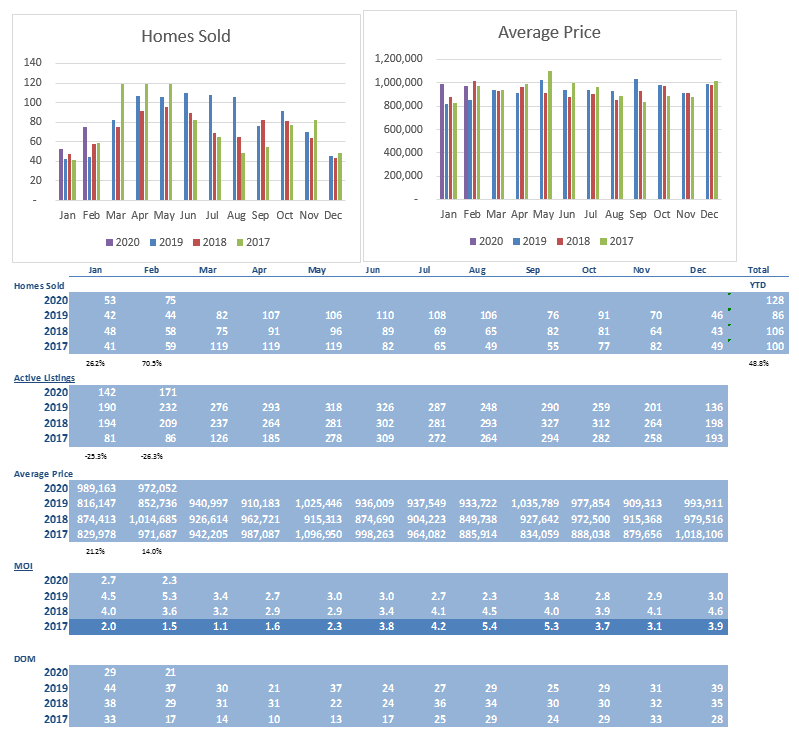
City of Toronto
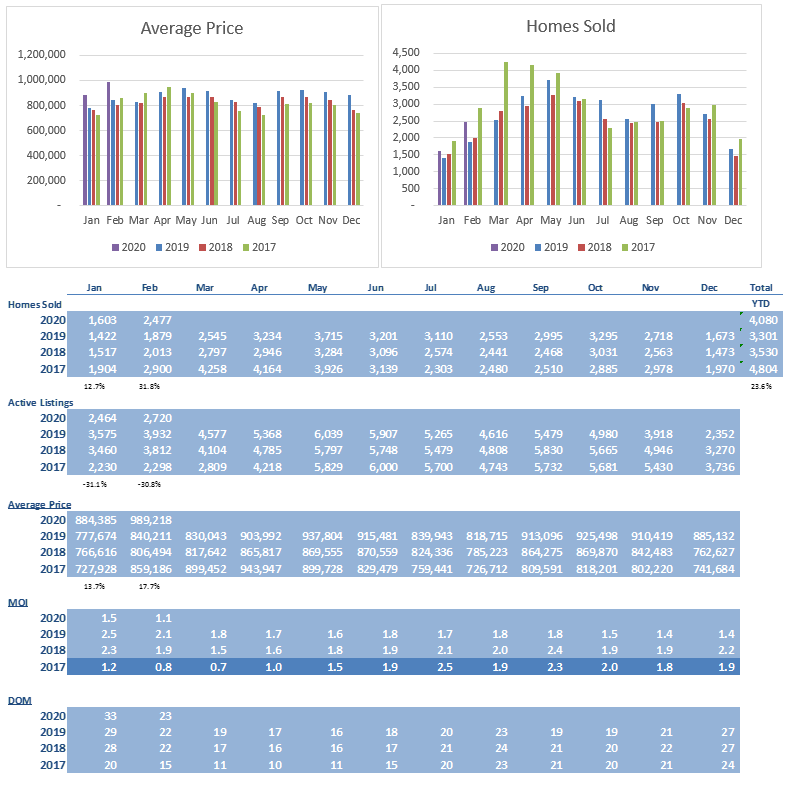
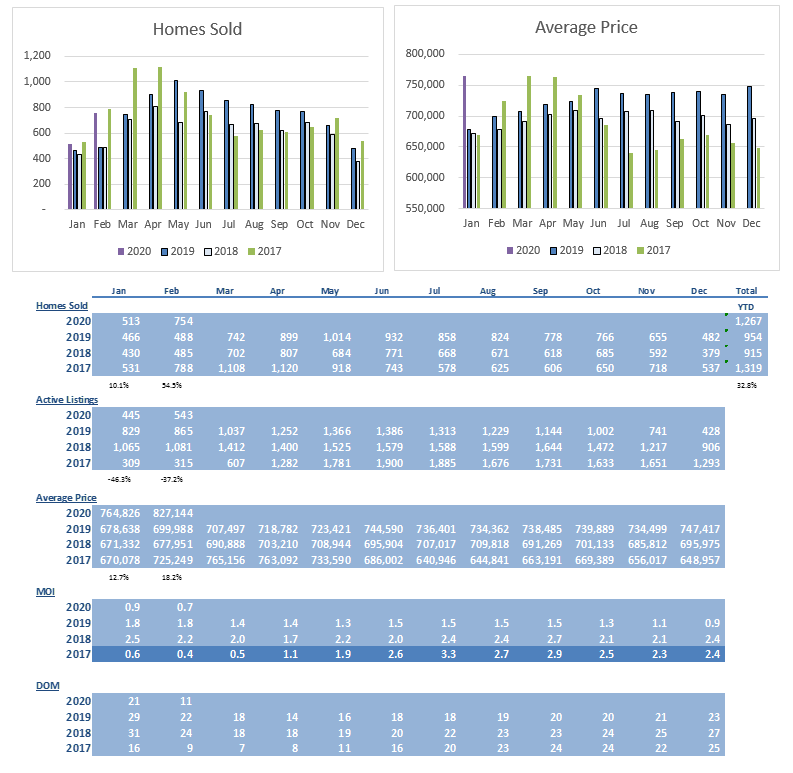
Toronto prices rose to $989,218 (up 17.7%) over February of 2019. There was a significant jump in prices during the month of February as prices increased 11.9% from the end of January 2020. There were strong increases across most housing types and was driven by a significant decrease in supply, as there were only 1.1 months of inventory on hand at the end of February compared to 2.1 months of inventory on hand at the same time last year. This tight supply will continue to create significant upward pressure on average prices moving forward.
Days on market have remained similar to prior year at 23. The number of homes trading hands rose a significant 31.8% to 2,477.
Brampton
Brampton prices rose to $827,144 (up 18.2%) over February of 2019. There was a significant jump in prices during the month of February as prices increased 8.2% from the end of January 2020. There were strong increases across most housing types and was driven by a significant decrease in supply, as there were only 0.7 months of inventory on hand at the end of February compared to 1.8 months of inventory on hand at the same time last year. This tight supply will continue to create significant upward pressure on average prices moving forward.
Days on market have improved dramatically to 11 from 22 at the same time a year ago. The number of homes trading hands rose a significant 54.5% to 754.
Mississauga
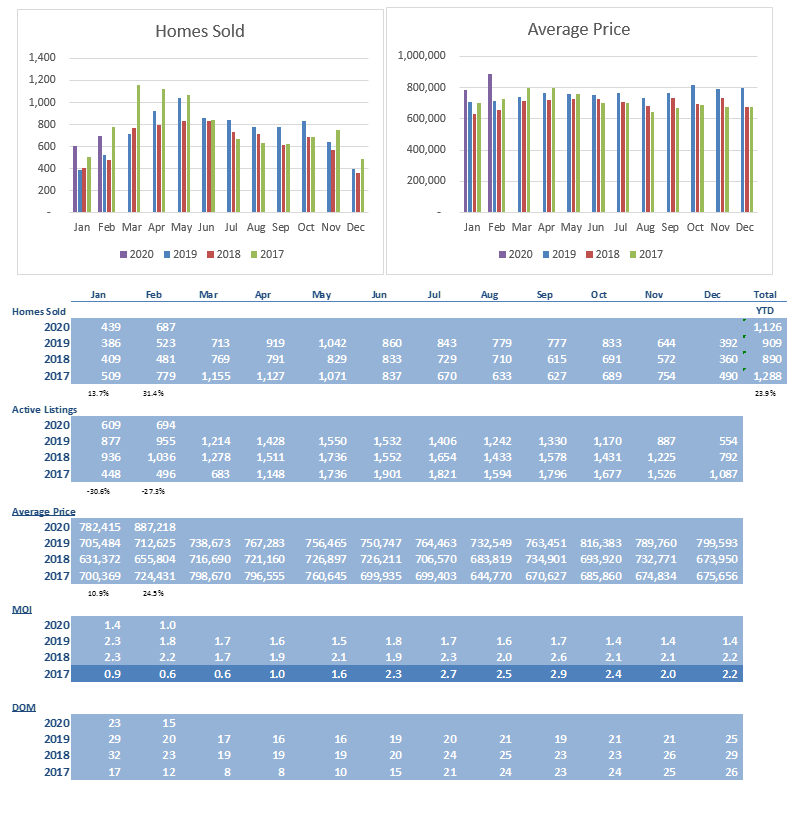
Mississauga market showed significant momentum in February. Average prices increased 24.5% to $887,218 while and number of homes sold increased by 31.4% compared to February of 2019. There was a significant jump in prices during the month, as prices increased by 13.4% from the end of January 2020.
This improvement in prices was a direct result of the significant tightening of supply of homes available for sale of only 1.0 month. This level of supply will continue to put upward pressure on price moving forward.
Days on market for the month of 15 was also a noticeable improvement over February of 2019 value of 20 days.
Caledon
Average price of $972,052 increased 14.0% from the same time last year. Activity increased by 70.5% to 75 homes.
Days on market of 21 improved significantly from the 37 days on market experienced during February 2019.
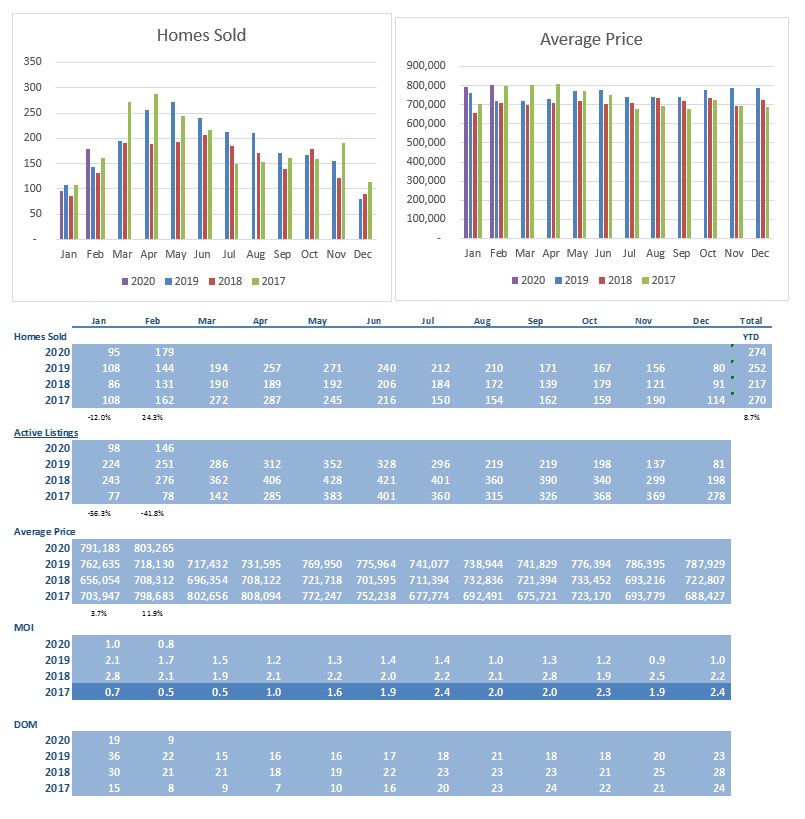
Milton
Average price of $803,183 was up 11.9% over February 2019. Activity for the month of 179 homes was up 24.3% compared to February of 2019.
There was only 0.8 month of inventory on hand, and thus should continue to create upward pressure on average prices moving forward.
Days on market improved dramatically to 9 from 22 experienced in February 2019.
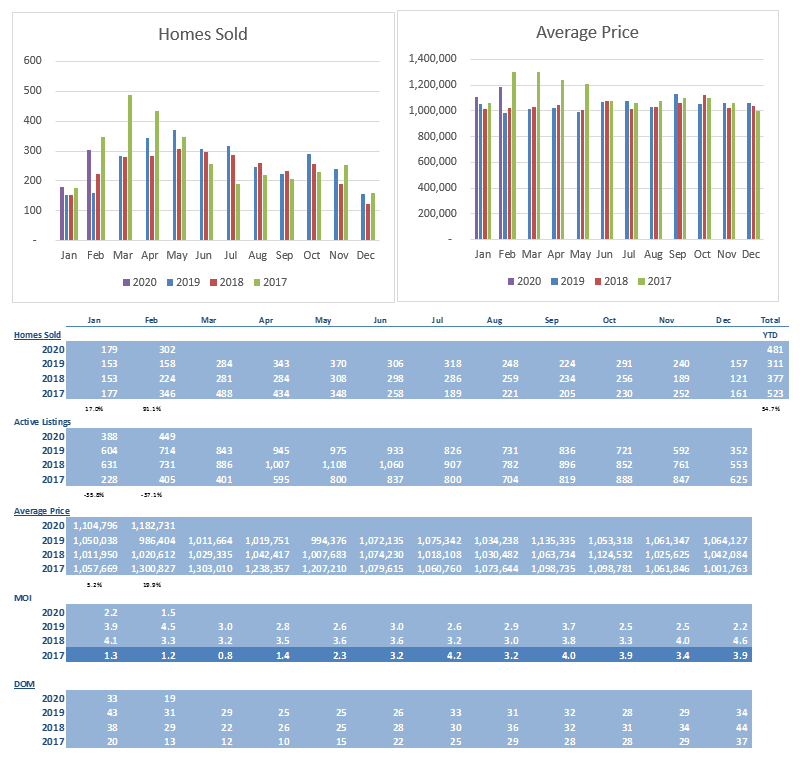
Oakville
Oakville market strengthened further this month as average price of $1,182,731 is up 19.9% from February 2019.
Year over year sales are up a dramatic 91.1% to 302 homes.
Supply tightened to 1.5 months of inventory on hand and accordingly should continue to put upward pressure on prices moving forward.
Days on market improved dramatically to 19 from 31 during February 2019.
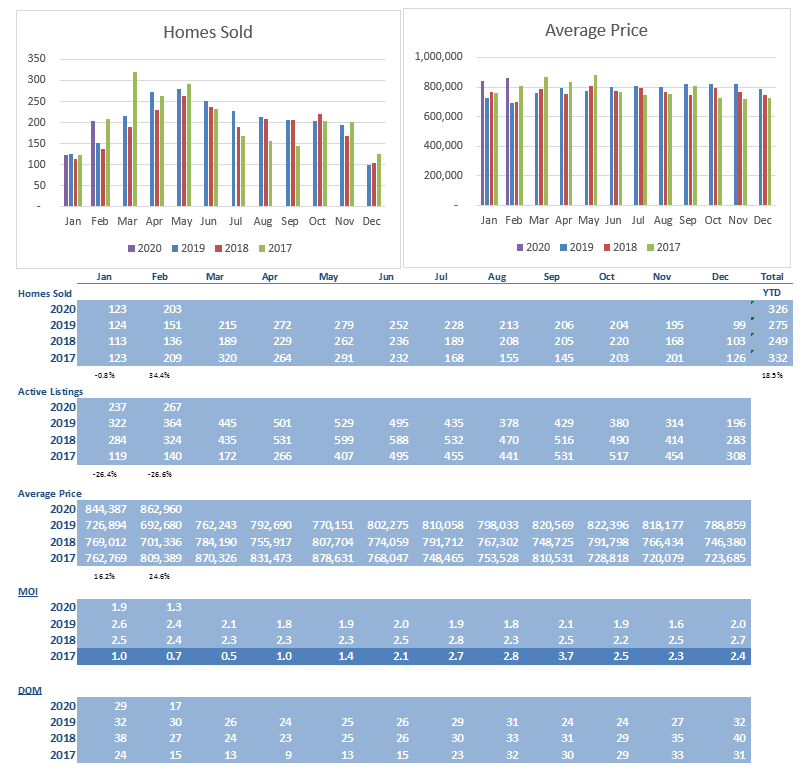
Burlington
Prices rose dramatically to $862,960 (up 24.6% from February 2019).
February sales Increased by 34.4% to 203 homes.
Supply tightened to 1.3 months of inventory on hand compared to 2.4 for the same period in 2019. This tight supply should continue to put upward pressure on prices moving forward.
Days on market have improved to 17 from 30 at the same time last year.
Georgetown
Average price in February 2020 of $889,856 is up 26.2% from February 2019. Number of transactions is up a dramatic 54.5% to 85 homes over the same period.
Supply was at 1.0 months of inventory on hand and thus is in tight market territory which should result in further price increases moving forward.
Days on market was a healthy 22.
Conclusion
The market should moderate somewhat for number of homes trading hands in the short run during the COVID 19 pandemic, however the scarce inventory and lower interest rates will continue to put upward pressure on prices.
*Some Key Economic indicators for a healthy real estate forecast:
Peel Region expected to grow by 500,000 people in next 2 decades https://www.insauga.com/500000-new-residents-expected-in-mississauga-and-surrounding-cities-over-next-two-decades
BOC holds rate January 22, 2020 https://www.bankofcanada.ca/2020/01/fad-press-release-2020-01-22/
Key economic indicators – Statistics Canada https://www.statcan.gc.ca/eng/start
Consumer confidence index https://www.conference-board.org/data/consumerconfidence.cfm
#200 - 10 Kingsbridge Garden Circle
Mississauga, Ontario, L5R 3K6
Office: (905/416) 456-1000
Fax: ( 905) 502-1555
391 Main St. N.
Brampton, Ontario, L6X 1N7
Office: (905/416) 456-1000
Fax: (905) 456-8116
295 Queen St. E.
Brampton, Ontario, L6W 3R1
Office: (905/416) 456-1000
Fax: (905) 456-1924
#209 - 164 Sandalwood Pky. E.
Brampton, Ontario, L6Z 3S4
Office: (905/416) 456-1000
Fax: (905) 840-2344
New Listings
Open Houses
Homes For Lease
The RE/MAX Collection
Commerical Properties
Neighbourhood Watcher™
Neighbourhood Solds
Preferred Client Registration
Find My Dream Home
What's My Home Worth?
Mortgage Pre-Approval
Mortgage Calculator
Land Transfer Tax
The information contained on this site is based in whole or in part on information that is provided by members of The Canadian Real Estate Association, who are responsible for its accuracy. CREA reproduces and distributes this information as a service for its members and assumes no responsibility for its accuracy.
This website is operated by a brokerage or salesperson who is a member of The Canadian Real Estate Association.
The listing content on this website is protected by copyright and other laws, and is intended solely for the private, non-commercial use by individuals. Any other reproduction, distribution or use of the content, in whole or in part, is specifically forbidden. The prohibited uses include commercial use, "screen scraping", "database scraping", and any other activity intended to collect, store, reorganize or manipulate data on the pages produced by or displayed on this website.