STABLE MARKET SEES SIGNS OF SEASONAL IMPROVEMENT
April 5, 2019 Real Estate

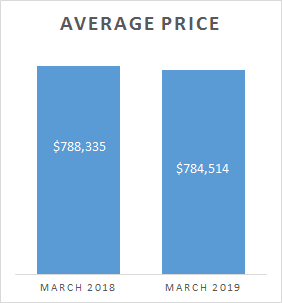
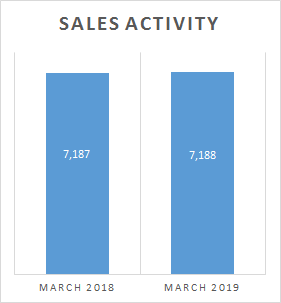
For the first quarter of 2019, sales are down by merely 1% compared to 2018’s first quarter.
As TREB analysts are pushing for a review of the current stress test provisions, we’ll soon see what their participation in the discussion for City of Toronto’s Housing Action Plan will yield long term for the GTA as a whole.
We continue to see buyer competition between listings due to low inventory. These tight conditions are enough to maintain adequate price growth, keeping the market stable.
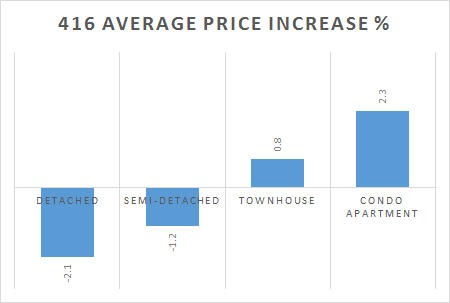
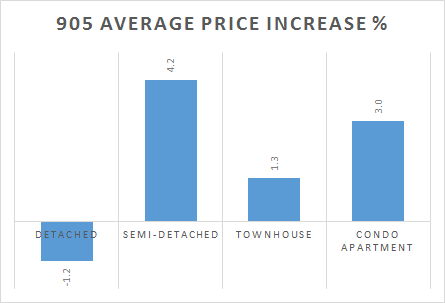
Again, we see there’s considerably disparity between the 905 and 416 regions regarding pricing averages. Semi-detached prices are being pushed up in the 905 due to demand and low inventory pushing potential owners farther out from the core of the GTA.
Condo prices continue to climb steadily in both regions.
Sales activity in March shows a considerable uptick from February and is in keeping with the rates from last year around this time as well. Spring is truly coming and rejuvenating the market as usual.
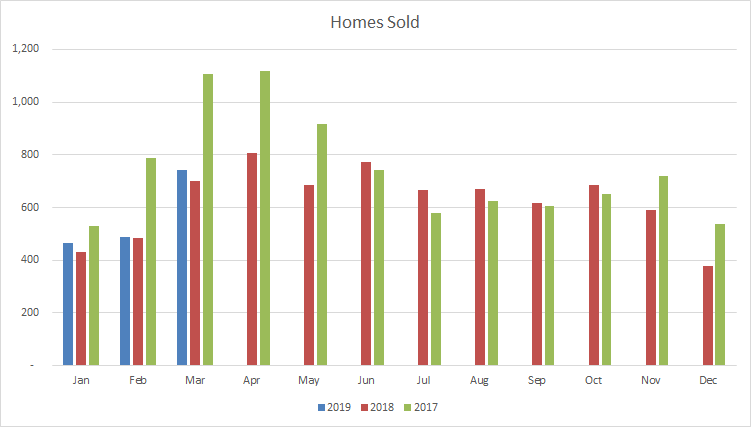
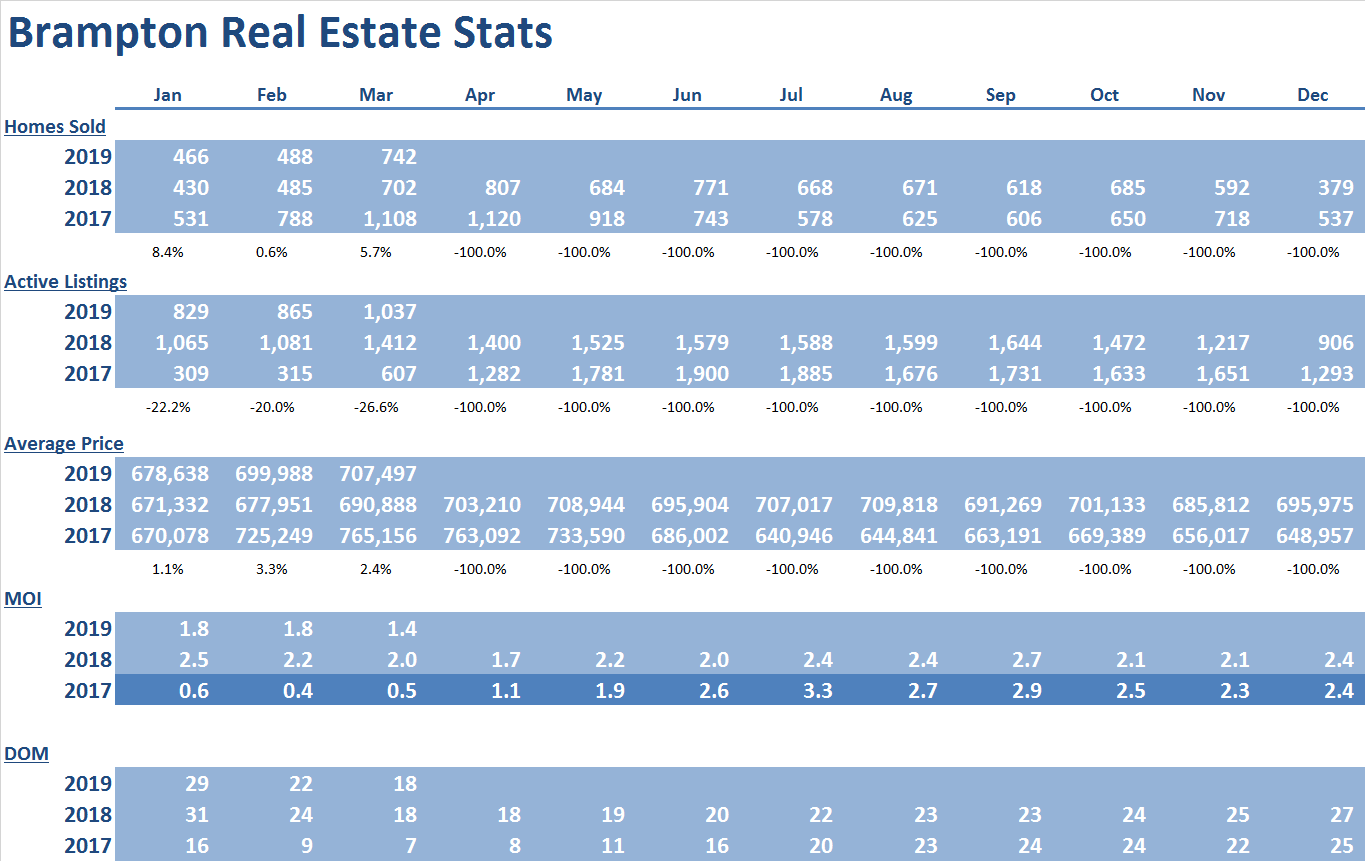
Brampton
 |
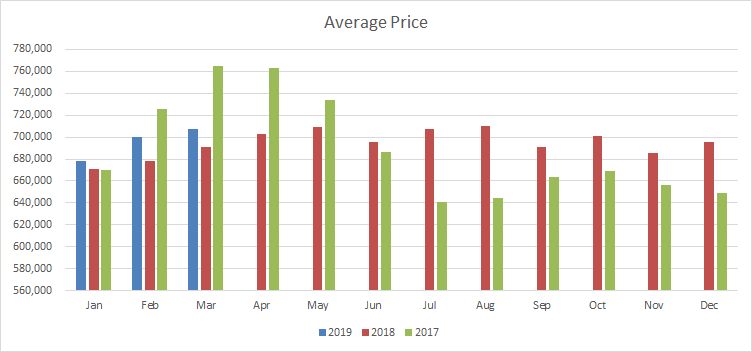 |
Brampton sales activity and prices continue to climb across all housing types. A six percent increase in homes sold from last year is primarily driven by Townhouse properties in this region.
Months of inventory have reduced further (1.4), but with the Days on Market in keeping with last year at 18. This tight supply will continue to maintain upward pressure on average prices moving forward.
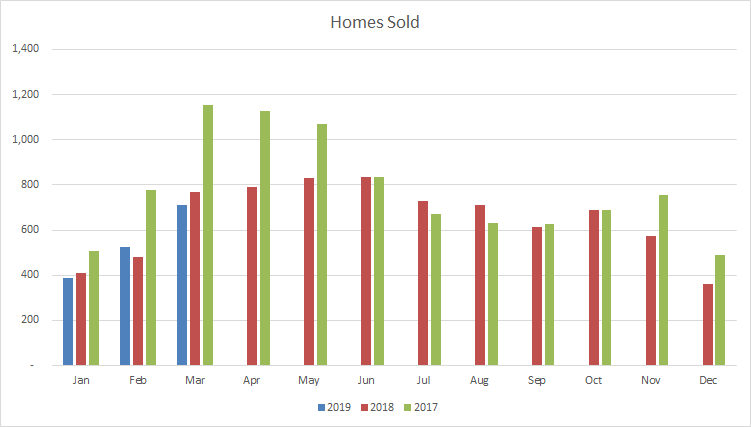
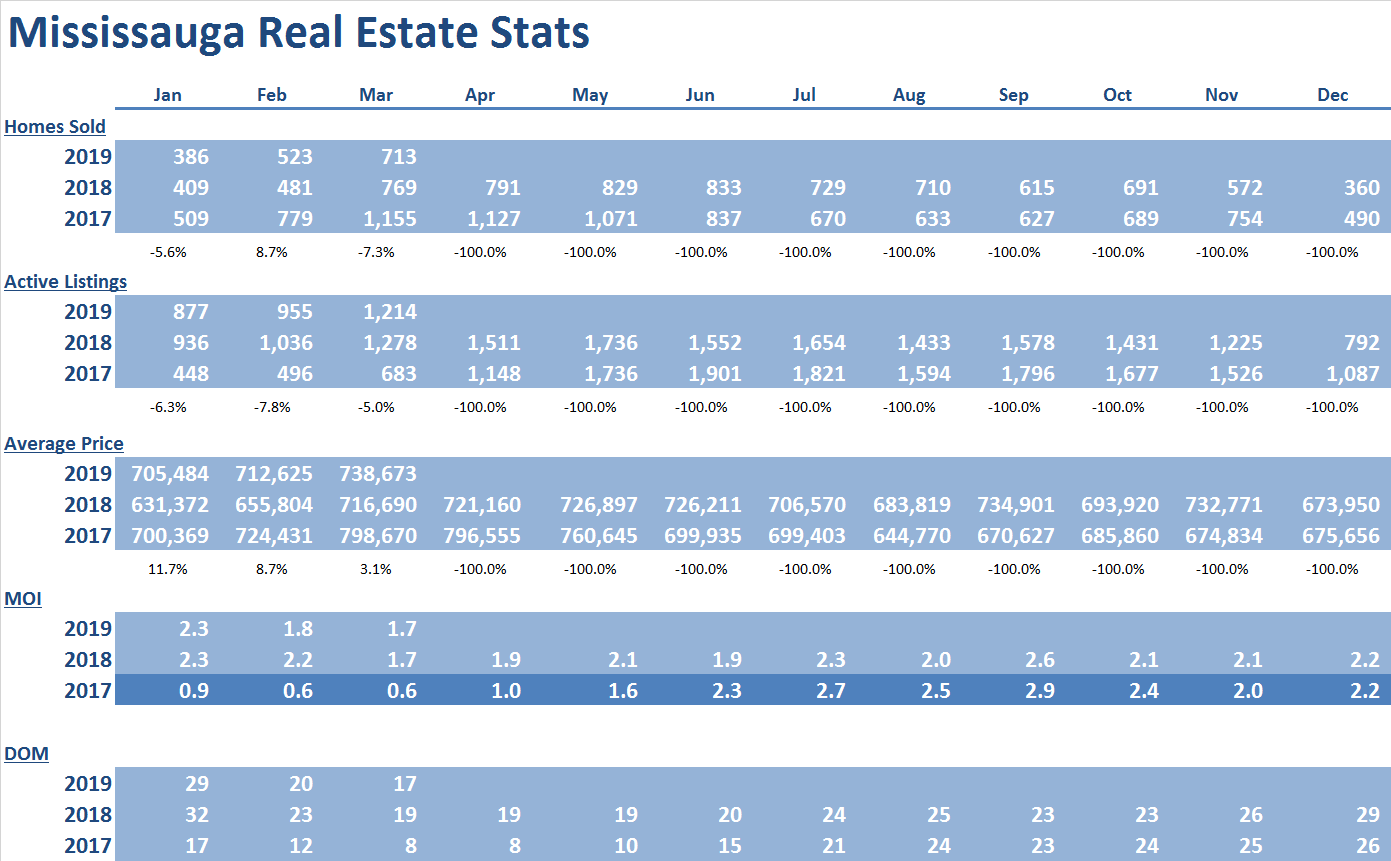
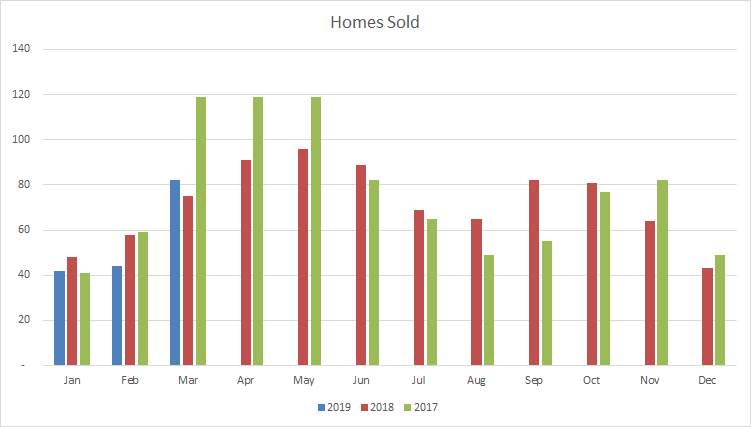
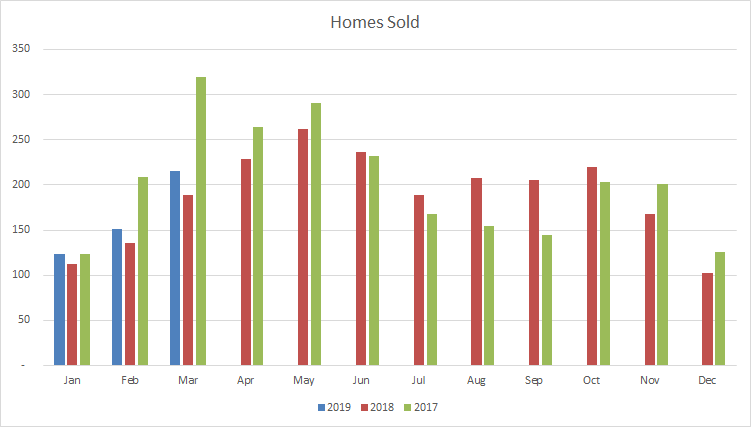
Mississauga
 |
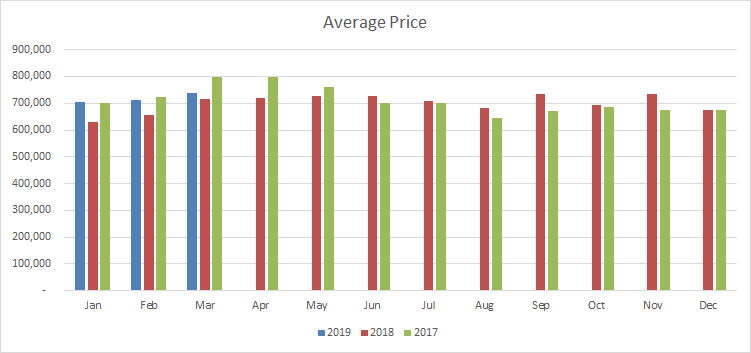 |
The spike in activity for Mississauga in February has leveled out. This month, we see decrease in activity and less price fluctuation (3% increase) in comparison to last March.
Months of inventory remain stable and we see days on market reduced to 17. That’s an improvement from last month as well as last year.
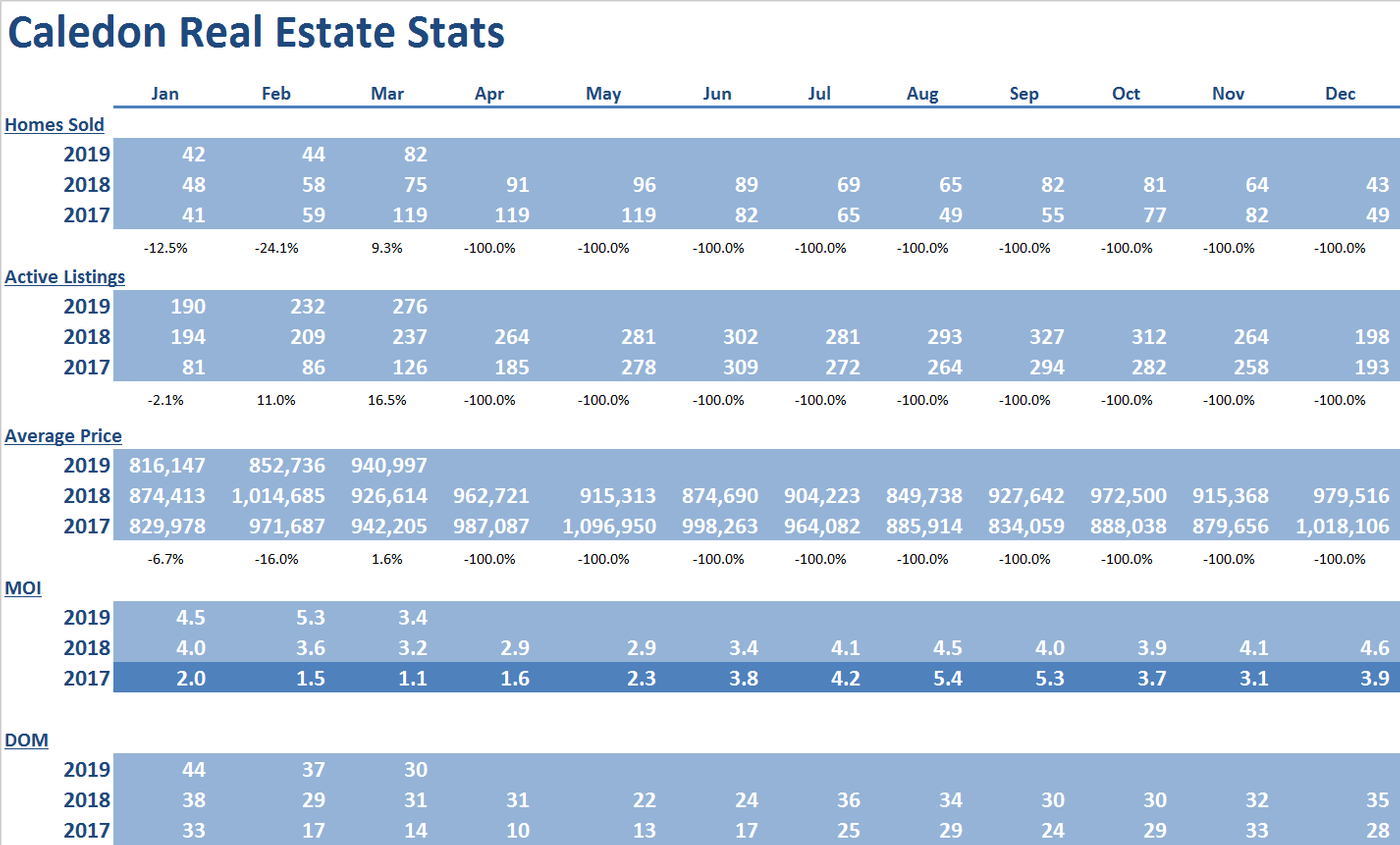
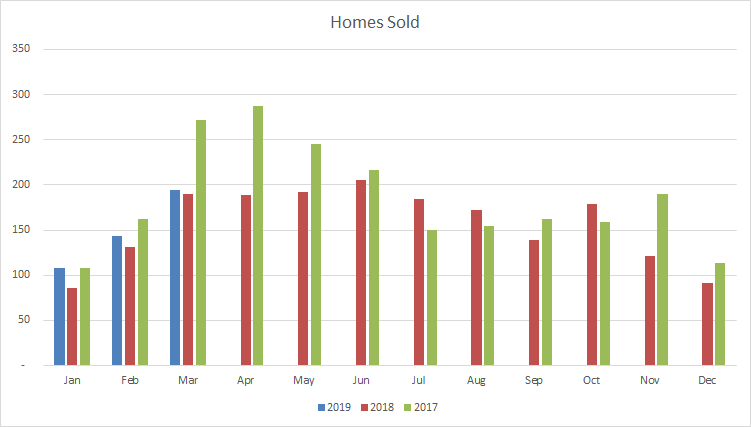
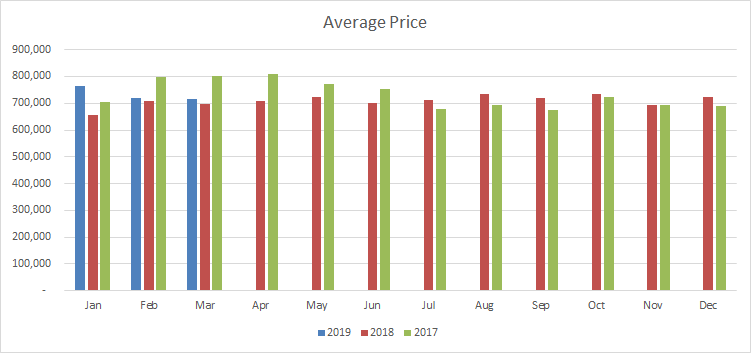
Caledon
 |
 |
The Caledon market has shown improvement with prices nearly reaching the highs of 2017 and homes sold up 9% from last year. As there are very few homes traded in Caledon a clearer picture of the market trajectory will appear as we get further into the year, but this month proves a positive indicator.
Average price of $940,997 is mostly a reflection of the mix of homes traded rather than the trend of where prices are headed.
Supply adjusted to 3.4 months of inventory. We expect low single digit price increases moving forward.
Days on market of 30 is a slight improvement to last year (31).
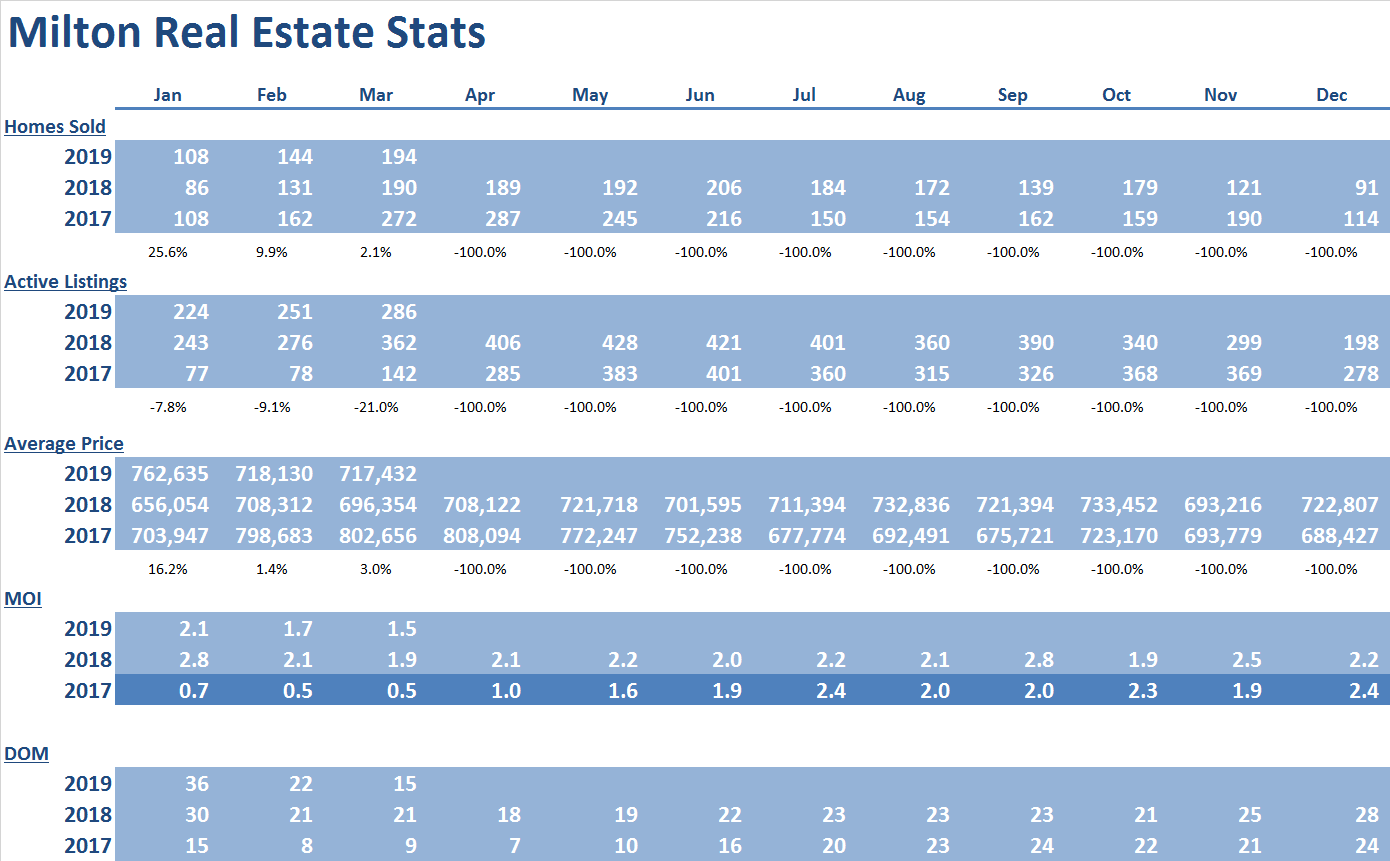
Milton
 |
 |
Milton market continues to strengthen exceeding last year’s numbers for this whole first quarter. Homes sold increase at a respectable 2% with average prices also up by 3%.
Supply tightened from February’s 1.7 to 1.5 this month. This should continue to create upward pressure on average prices moving forward.
Days on market improved to 15 from last month’s 22 and last year’s 21.
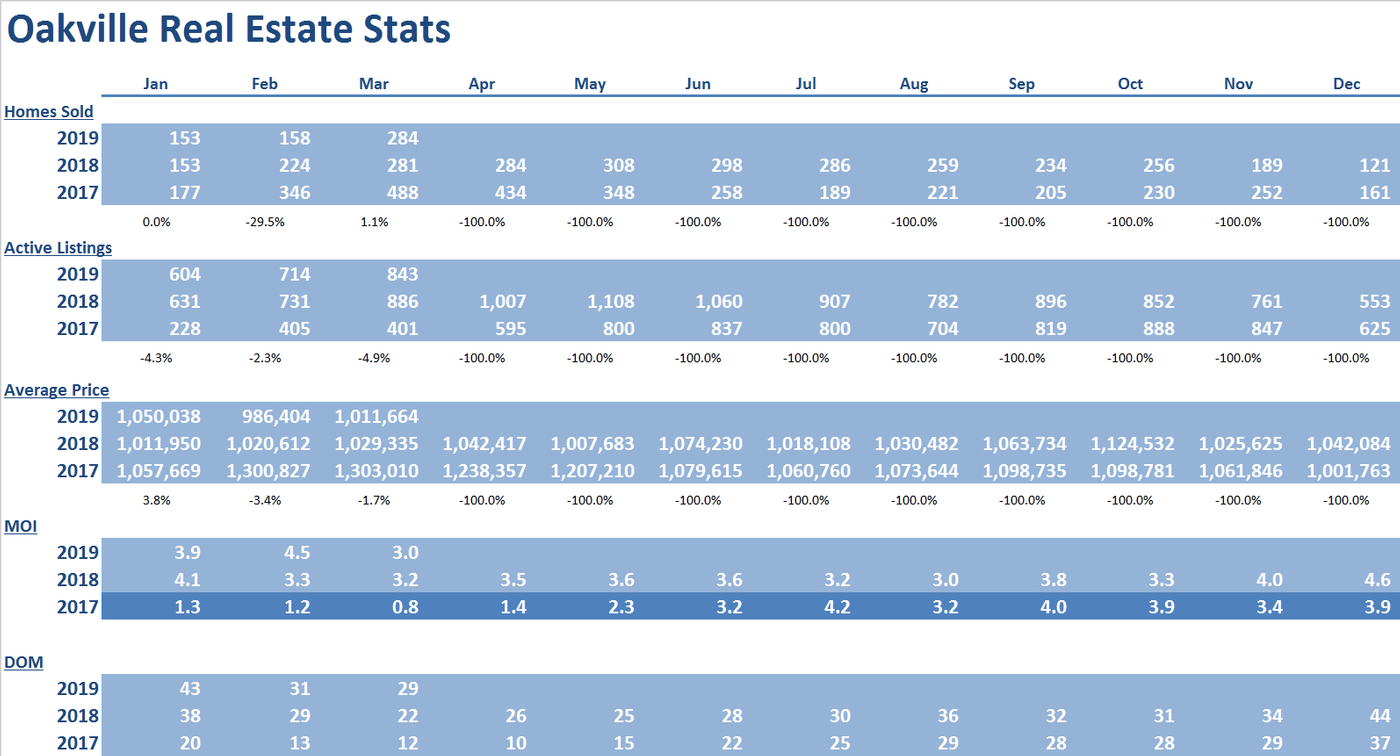
Oakville
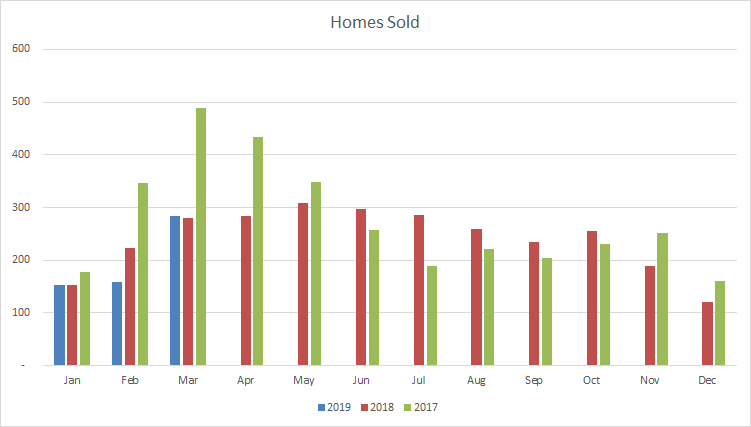 |
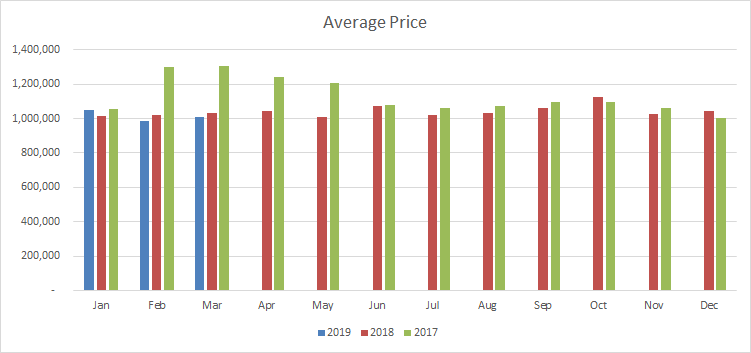 |
Average price is no longer dipping as much as it was in February (3%), but still down from last year by 1.7%.
Months of inventory reduces to 3.0. Prices should increase a modest low single digit moving forward.
Days on market continues to improve for the year at 29.
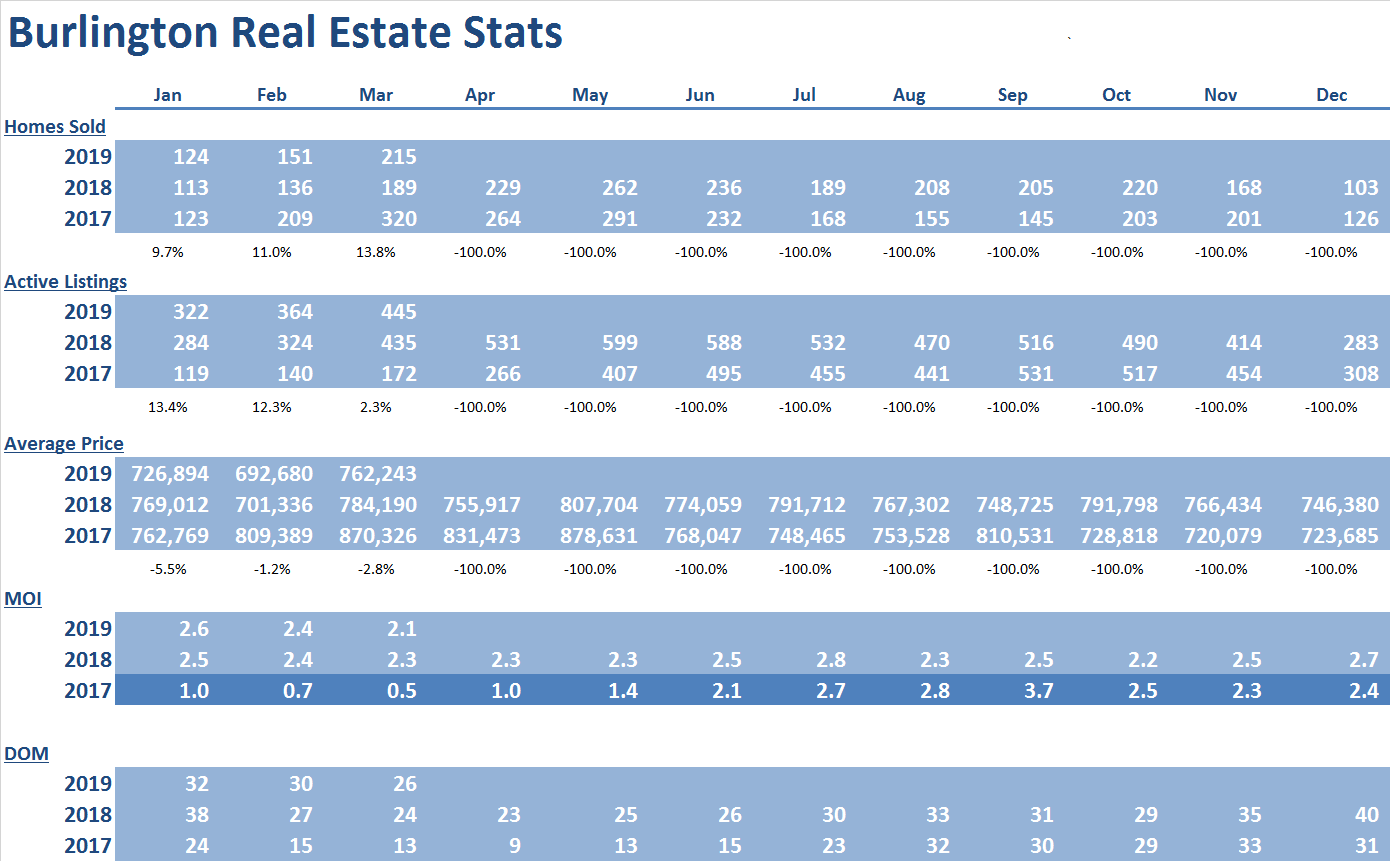
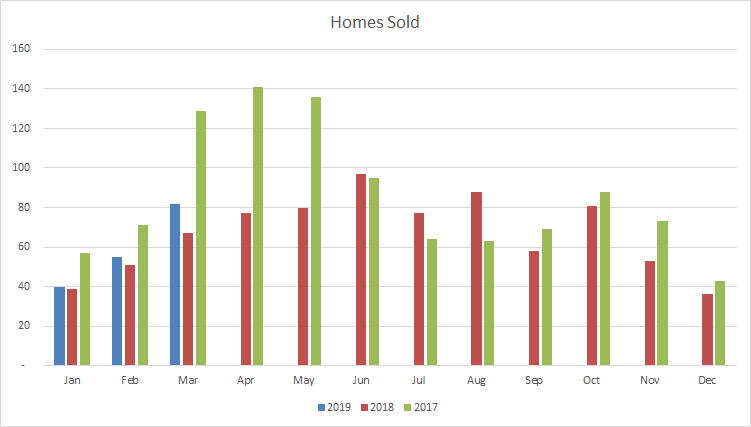
Burlington
 |
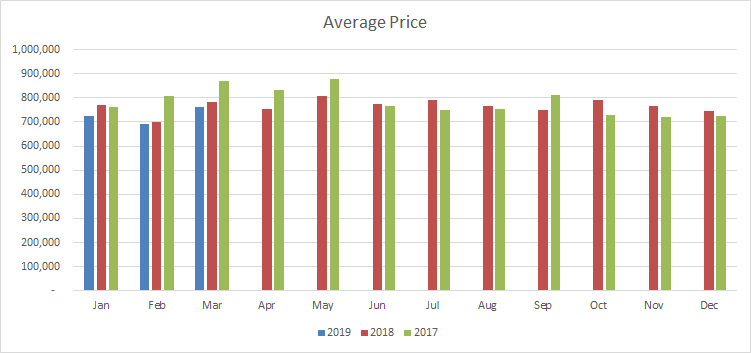 |
The number of homes sold in Burlington are up a whopping 14% from this time last year.
Prices improve slightly from February at $762,243, though down slightly from last year (-2.8%).
Supply tightened to 2.1 months of inventory on hand. This tight supply should put upward pressure on prices moving forward.
Days on market have improved to 26 which shows stability compared to last year’s 24.
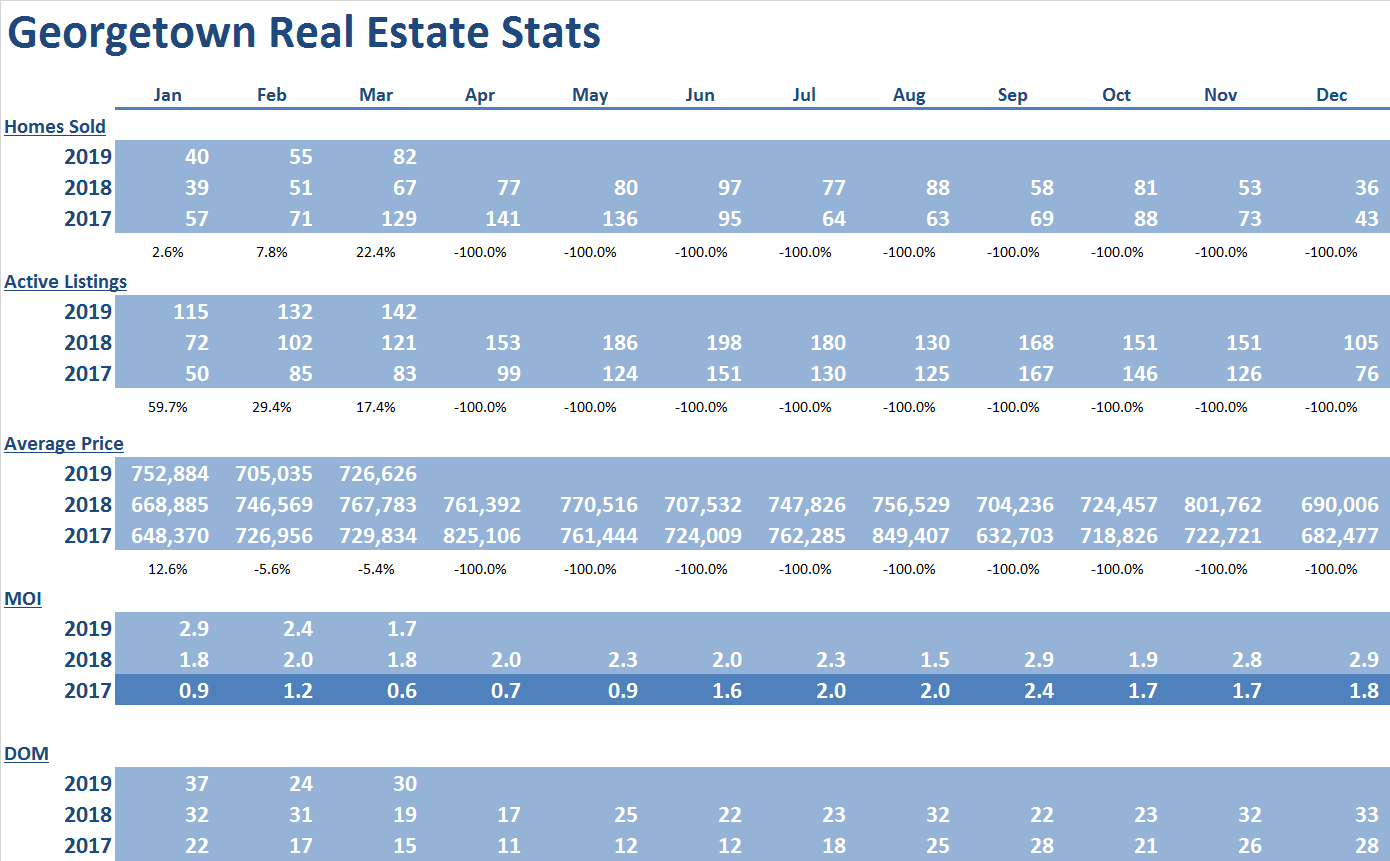
Georgetown
 |
 |
As there are very few homes traded in Georgetown, and a clearer picture of the real estate market will appear as we get further into the year.
Average price of $726,626, down 5.4% from last year, is mostly a reflection of the mix of homes traded rather than the trend of where prices are headed.
A slight improvement from last year, supply reduced to 1.7 months of inventory.
Days on market of 30 is an improvement from the 33 days on market experienced at the end of 2018.
Conclusion
We continue to see buyer competition between listings due to low inventory. These tight conditions are enough to maintain adequate price growth, keeping the market stable.
*Some Key Economic indicators for a healthy real estate forecast:
Mississauga House Prices indicate the spring market is stable https://www.insauga.com/house-prices-inching-upwards-again-in-mississauga
Bank of Canada Annual Report Released https://www.bankofcanada.ca/2019/04/release-annual-report-2018/
Tourism spending up 3.3% from 2018. International interest means good things for the economy https://www150.statcan.gc.ca/n1/daily-quotidien/190328/dq190328a-eng.htm?HPA=1
#200 - 10 Kingsbridge Garden Circle
Mississauga, Ontario, L5R 3K6
Office: (905/416) 456-1000
Fax: ( 905) 502-1555
391 Main St. N.
Brampton, Ontario, L6X 1N7
Office: (905/416) 456-1000
Fax: (905) 456-8116
295 Queen St. E.
Brampton, Ontario, L6W 3R1
Office: (905/416) 456-1000
Fax: (905) 456-1924
#209 - 164 Sandalwood Pky. E.
Brampton, Ontario, L6Z 3S4
Office: (905/416) 456-1000
Fax: (905) 840-2344
New Listings
Open Houses
Homes For Lease
The RE/MAX Collection
Commerical Properties
Neighbourhood Watcher™
Neighbourhood Solds
Preferred Client Registration
Find My Dream Home
What's My Home Worth?
Mortgage Pre-Approval
Mortgage Calculator
Land Transfer Tax
The information contained on this site is based in whole or in part on information that is provided by members of The Canadian Real Estate Association, who are responsible for its accuracy. CREA reproduces and distributes this information as a service for its members and assumes no responsibility for its accuracy.
This website is operated by a brokerage or salesperson who is a member of The Canadian Real Estate Association.
The listing content on this website is protected by copyright and other laws, and is intended solely for the private, non-commercial use by individuals. Any other reproduction, distribution or use of the content, in whole or in part, is specifically forbidden. The prohibited uses include commercial use, "screen scraping", "database scraping", and any other activity intended to collect, store, reorganize or manipulate data on the pages produced by or displayed on this website.