April Market Update 2020
May 8, 2020 Announcements
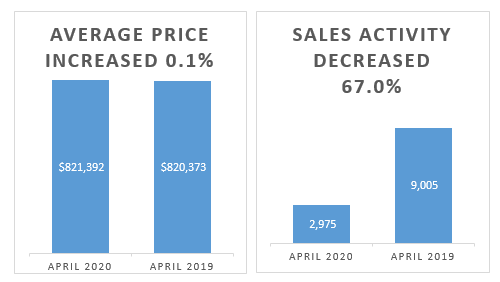
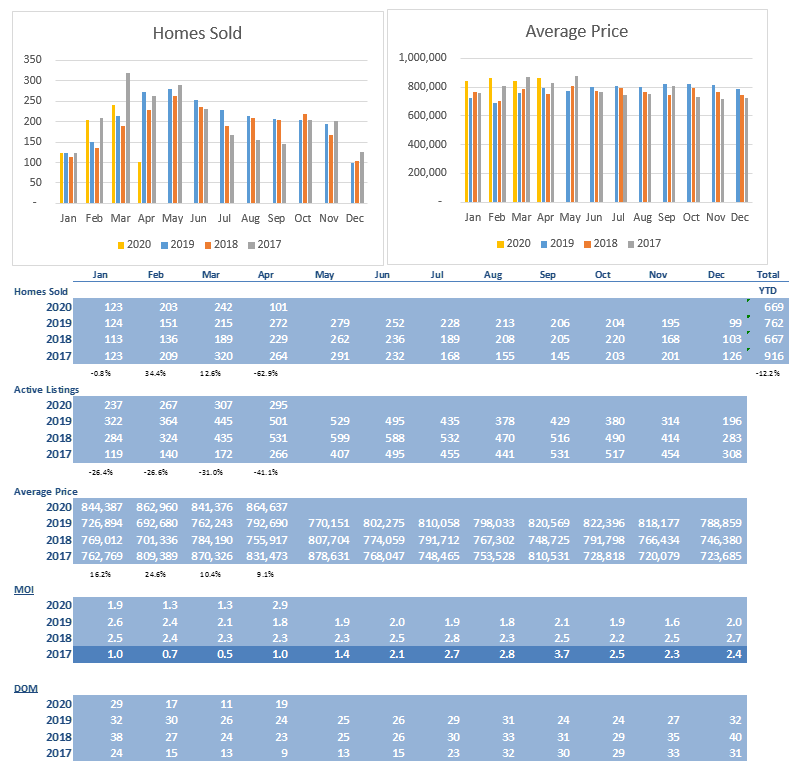
Prices remain stable in April as sales begin to rise
The average selling price for April 2020 transactions was $821,392 – up very slightly by 0.1 per cent compared to the average price of $820,373 reported for April 2019.
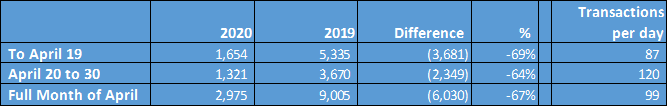
Greater Toronto Area REALTORS® reported 2,975 residential transactions through TRREB’s MLS® System. This result was down by 67 per cent compared to April 2019. The industry expected a deep decrease due to COVID 19, however based on the transactions per day, it appears that the worst is behind us. The lowest point during this crisis appears to be during the first 19 days of the month as only 87 homes traded hands per day. From April 20th to the end of the month, there were 120 homes selling per day – an increase of 38%.
The increase in transactions appears to be continuing in May. Transactions are directly related to the number of appointments made by brokerages for their listings. Appointments were up 43% during the first 7 days of May compared to the last 7 days of April for RE/MAX Realty Services.
New listings amounted to 6,174 in April 2020 – down on a year-over-year basis by a similar rate compared to sales (-64.1 per cent). Accordingly, inventory remains in relatively short supply at 3.5 months of inventory on hand as of the end of April. Industry insiders view anything under 4 months as tight supply and a sellers’ market, 4 to 6 months as balanced market and above 6 as a buyers’ market.
The trend for the MLS® Home Price Index (HPI) Composite Benchmark, which had been on an upward trajectory since the beginning of 2019 flattened in April. On a year-over-year basis, the Benchmark was up by 10 per cent. The MLS® HPI indices represent prices for typical homes with consistent attributes from one period to the next. The fact that the MLS® HPI was up year-over-year by a greater rate than the average selling price suggests that the share of higher end deals completed in April 2020 versus April 2019 was down. The MLS® HPI increased from February 2020 by 2.8% while the average price decreased by 9.8%. This suggests that share of higher end deals completed in February 2020 versus April 2020 was down, while the prices for similar properties remained relatively stable. This is a significant finding as February represented the highest average price on record and most would assume since average price is down that their property values are down. This is generally not the case at all as indicated by MLS® HPI. One needs to look at similar properties in localized areas to asses the true trend. That trend shows stability across the board.
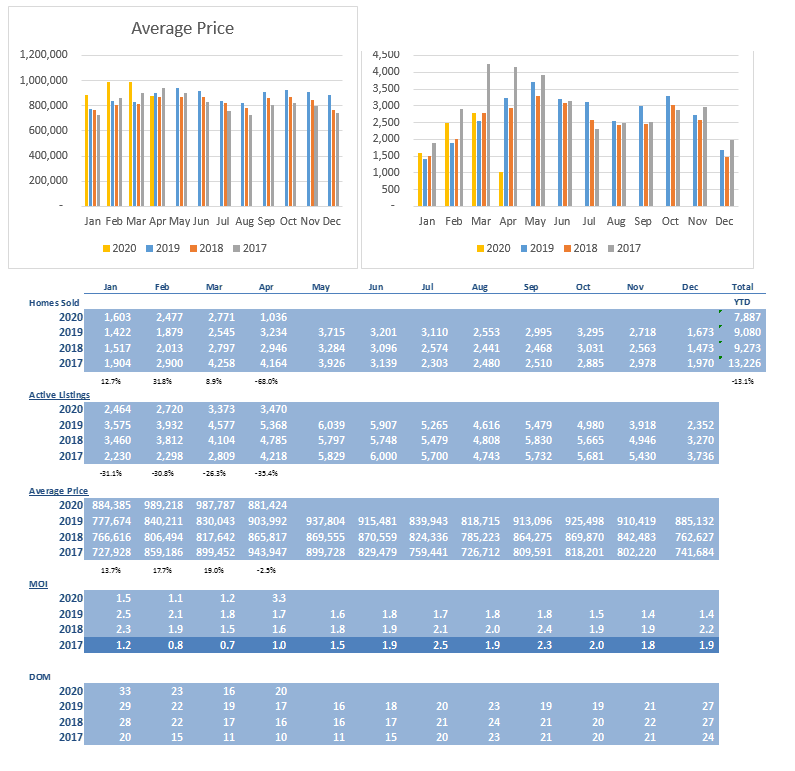
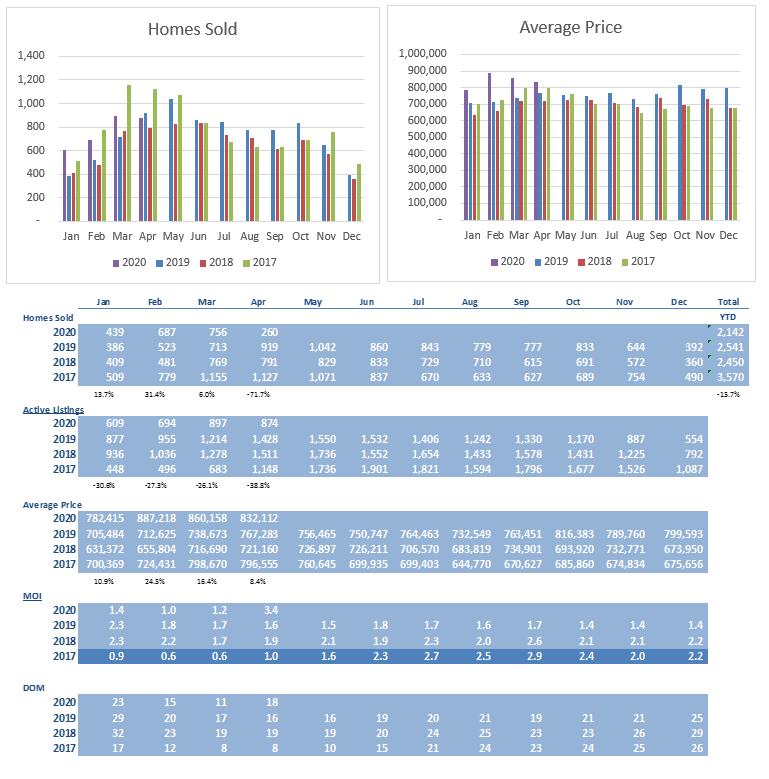
City of Toronto
Toronto average prices fell to $881,424 which is 2.5% lower than April of 2019. This was also down 10.9% from the high this year which occurred in February of $989,218. However, the April 2020 MLS® HPI increased 10.4% and 3.4% from April 2019 and February 2020, respectively. This suggests that share of higher end deals completed in April 2019 and February 2020 versus April 2020 was down, while the prices for similar properties increased over both time periods.
The inventory supply remained relatively tight at 3.3 months on hand at the end of April.
Days on market increased from 17 in April 2019 to 20 in April 2020.
The number of homes trading hands fell by 68% from April 2019 to 1,036.
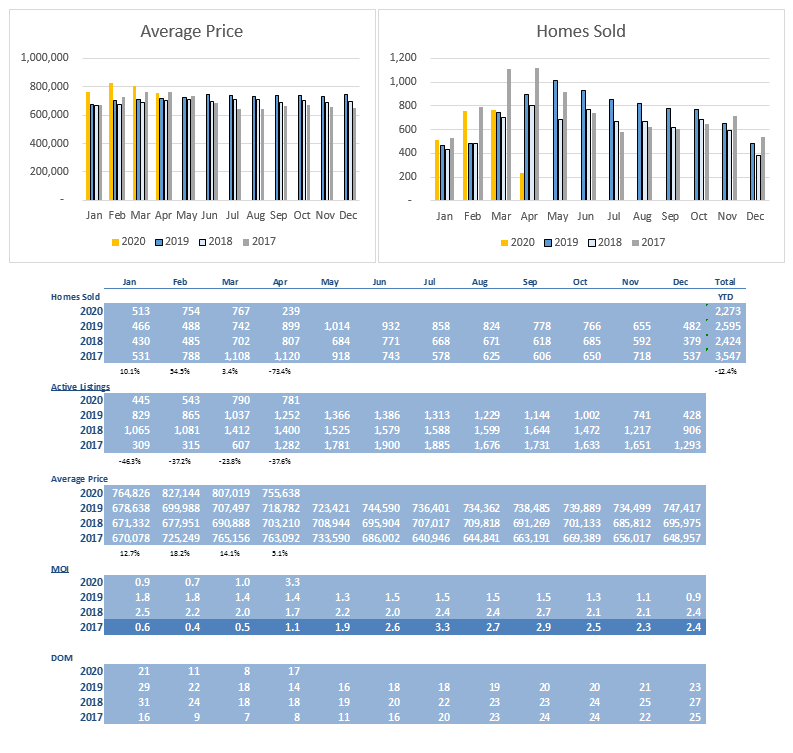
Brampton
Average prices rose to $755,638 which is 5.1% higher than April of 2019. This was down 8.6% from the high this year which occurred in February of $827,144. However, the April 2020 MLS® HPI increased 3.4% from February 2020. This suggests that share of higher end deals completed February 2020 versus April 2020 was down, while the prices for similar properties remained stable.
The inventory supply remained relatively tight at 3.3 months on hand at the end of April.
Days on market increased from 14 in April 2019 to 17 in April 2020.
The number of homes trading hands fell by 73% from April 2019 to 239.
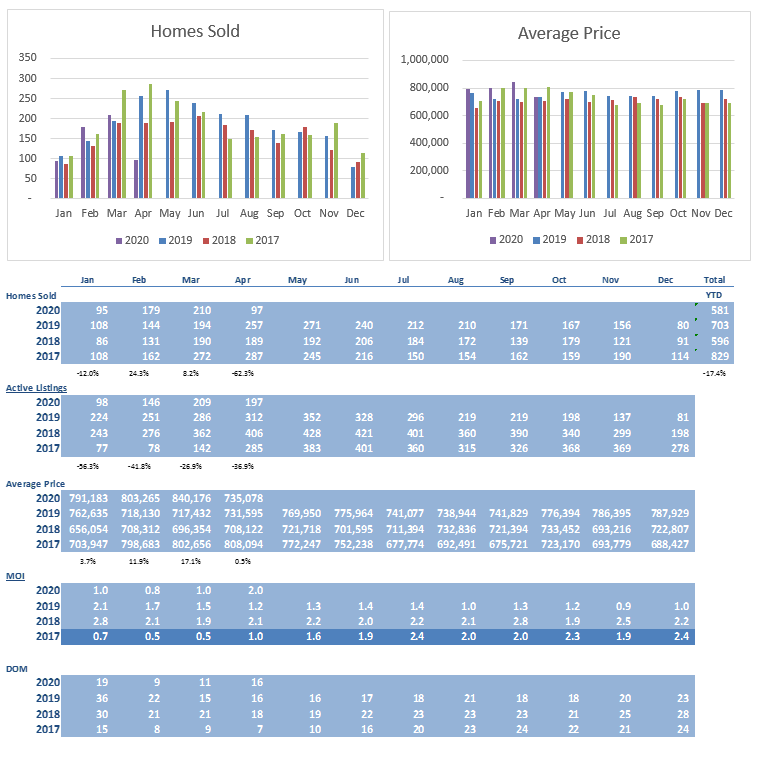
Mississauga
Average prices rose to $832,112 which is 8.4% higher than April of 2019. This was down 6.2% from the high this year which occurred in February of $887,218. However, the April 2020 MLS® HPI increased 3.7% from February 2020. This suggests that share of higher end deals completed February 2020 versus April 2020 was down, while the prices for similar properties remained stable.
The inventory supply remained relatively tight at 3.4 months on hand at the end of April.
Days on market increased from 16 in April 2019 to 18 in April 2020.
The number of homes trading hands fell by 71.7% from April 2019 to 260.
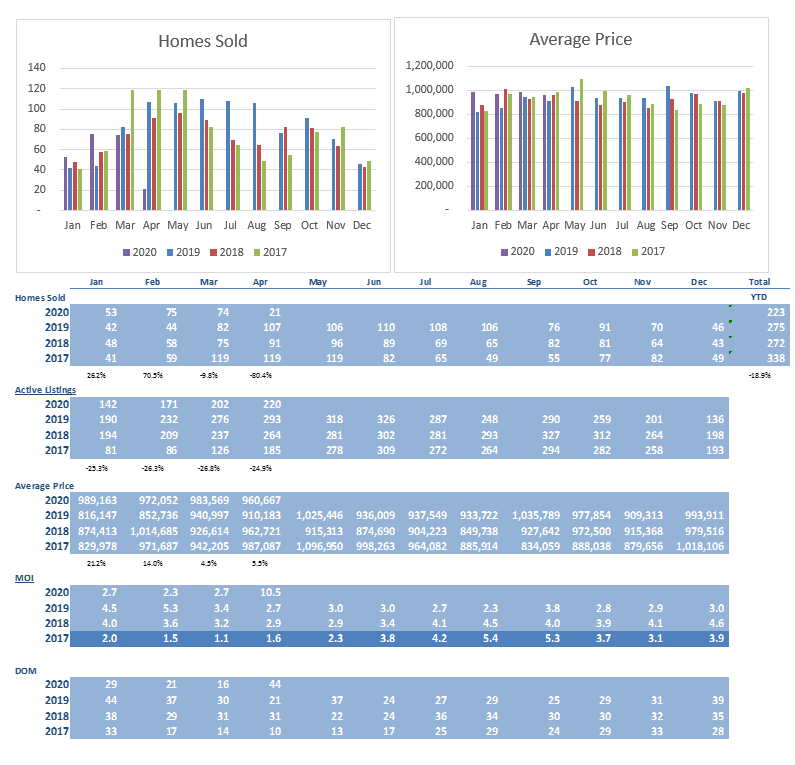
Caledon
Average prices rose to $960,667 which is 5.5% higher than April of 2019. This was down 2.9% from the high this year which occurred in January of $989,163. However, the April 2020 MLS® HPI increased 4.4% from January 2020. This suggests that share of higher end deals completed January 2020 versus April 2020 was down, while the prices for similar properties remained stable.
The inventory supply jumped dramatically in April to 10.5 months. The average for the first 3 months of the year was under 3 so at this point it appears to be a one month anomaly. This should be monitored closely moving forward.
Days on market increased from 21 in April 2019 to 44 in April 2020.
The number of homes trading hands fell by 80.4% from April 2019 to 21.
Milton
Average prices rose slightly to $735,078 which is 0.5% higher than April of 2019. This was down 12.5% from the high this year which occurred in March of $840,176. However, the April 2020 MLS® HPI decreased only 2.4% from March 2020. This suggests that share of higher end deals completed March 2020 versus April 2020 was down, while the prices for similar properties remained relatively stable.
The inventory supply remained very tight at 2.0 months on hand at the end of April.
Days on market remained at 16 in April 2020.
The number of homes trading hands fell by 62.3% from April 2019 to 97.
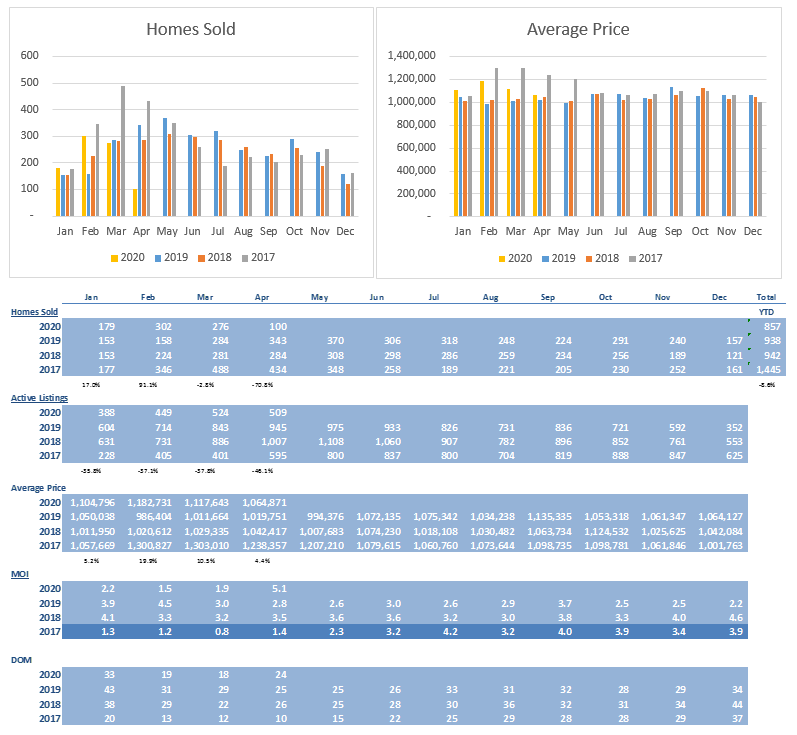
 Oakville
Average prices rose to $1,064,871 which is 4.4% higher than April of 2019. This was down 10.0% from the high this year which occurred in February of $1,182,731. However, the April 2020 MLS® HPI increased 1.7% from February 2020. This suggests that share of higher end deals completed February 2020 versus April 2020 was down, while the prices for similar properties remained relatively stable.
The inventory supply increased to 5.1 months on hand at the end of April.
Days on market dropped slightly in April 2020 to 24.
The number of homes trading hands fell by 70.8% from April 2019 to 100.
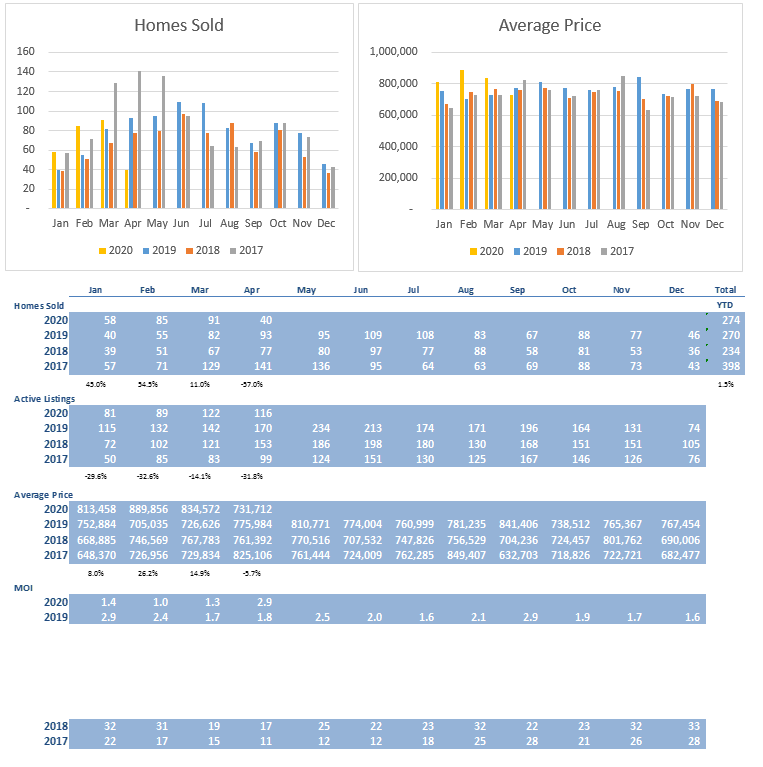
Burlington
Average prices rose to $864,637 which is 9.1% higher than April of 2019. This is also the highest priced reached in 2020.
The inventory supply remains at a tight 2.9 months on hand at the end of April.
Days on market dropped in April 2020 to 19 from 24 in April 2019.
The number of homes trading hands fell by 62.9% from April 2019 to 101.
Georgetown
Average prices fell to $731,712 which is 5.7% lower than April of 2019. This was down 17.8% from the high this year which occurred in February of $889,856. However, the April 2020 MLS® HPI increased 8.4% from April 2019 and was down a slight 0.2% from February 2020. This suggests that share of higher end deals completed in April 2019 and February 2020 versus April 2020 was down, while the prices for similar properties increased over April 2019 and remain stable with February 2020.
The inventory supply remained relatively tight at 2.9 months on hand at the end of April.
Days on market increased from 16 in April 2019 to 19 in April 2020.
The number of homes trading hands fell by 57.0% from April 2019 to 40.
Conclusion
We are expecting inventory to remain in short supply for the foreseeable future and as such, prices should remain stable, while the number of transactions should continue to increase dramatically as the province of Ontario rolls out it reopening plan.
#200 - 10 Kingsbridge Garden Circle
Mississauga, Ontario, L5R 3K6
Office: (905/416) 456-1000
Fax: ( 905) 502-1555
391 Main St. N.
Brampton, Ontario, L6X 1N7
Office: (905/416) 456-1000
Fax: (905) 456-8116
295 Queen St. E.
Brampton, Ontario, L6W 3R1
Office: (905/416) 456-1000
Fax: (905) 456-1924
#209 - 164 Sandalwood Pky. E.
Brampton, Ontario, L6Z 3S4
Office: (905/416) 456-1000
Fax: (905) 840-2344
New Listings
Open Houses
Homes For Lease
The RE/MAX Collection
Commerical Properties
Neighbourhood Watcher™
Neighbourhood Solds
Preferred Client Registration
Find My Dream Home
What's My Home Worth?
Mortgage Pre-Approval
Mortgage Calculator
Land Transfer Tax
The information contained on this site is based in whole or in part on information that is provided by members of The Canadian Real Estate Association, who are responsible for its accuracy. CREA reproduces and distributes this information as a service for its members and assumes no responsibility for its accuracy.
This website is operated by a brokerage or salesperson who is a member of The Canadian Real Estate Association.
The listing content on this website is protected by copyright and other laws, and is intended solely for the private, non-commercial use by individuals. Any other reproduction, distribution or use of the content, in whole or in part, is specifically forbidden. The prohibited uses include commercial use, "screen scraping", "database scraping", and any other activity intended to collect, store, reorganize or manipulate data on the pages produced by or displayed on this website.