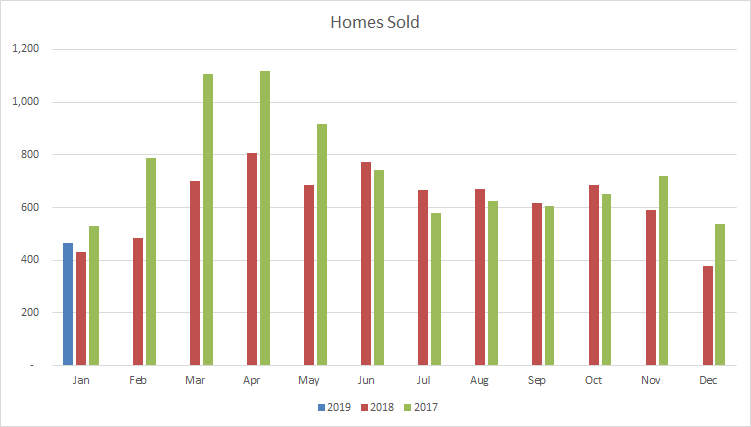
HOME SALES UP BY 0.6% COMPARED TO JANUARY 2018
February 8, 2019 Real Estate

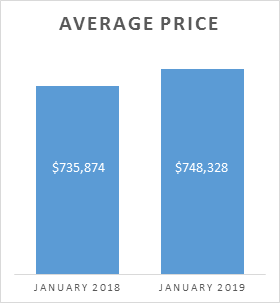
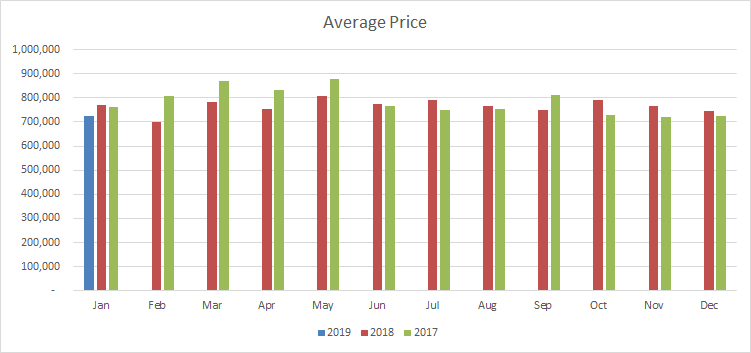
Prices are maintaining the increase trend from 2018 with prices rising 1.7% from last January. It is projected that prices should continue to climb and break 2017 records by the end of this year.
With the MOI rate secure, we have settled into a consistent seller’s market in most residential circumstances. In the case of detached homes the market has reached a balanced point. The idea of the market balancing can concern some, but it should be noted that a balanced market gives clients the opportunity to make calculated, informed choices instead of rushing in on the wild market presented in the past by 2017.
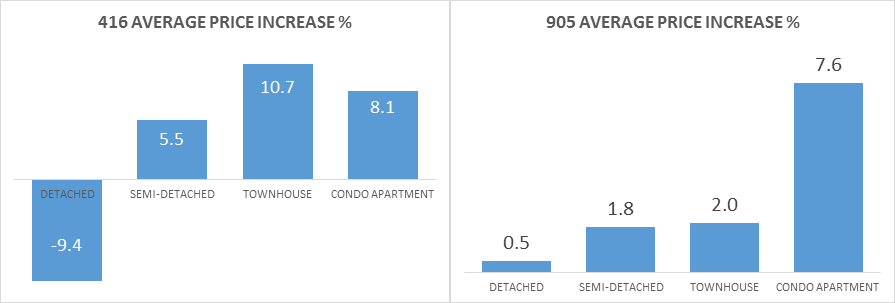
The increase in prices was driven by townhouses and condos this month. The 416 and the 905 price changes show a variation that emphasizes the different variables that effect their independent markets. Prices for detached properties in the 416 appear of have hit a ceiling, with all other residential types appreciating at a consistent rate. Whereas, the 905 is seeing a stark increase for condos (influenced by the new developments across Mississauga especially) with a more moderate increase for detached, semi-detached, and townhouse properties.
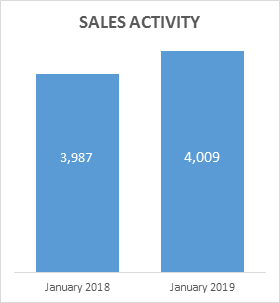
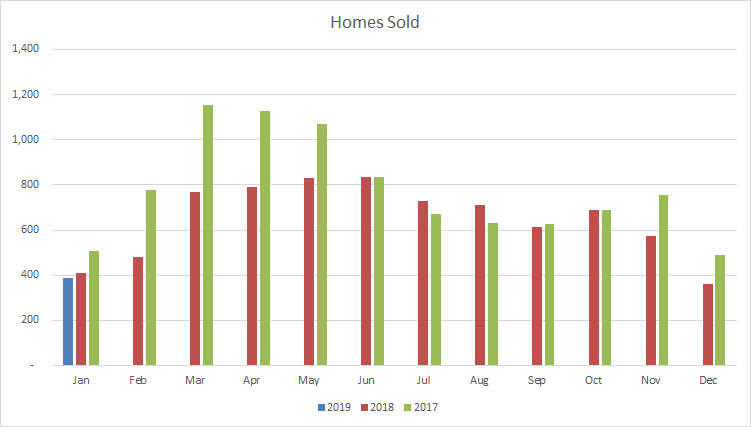
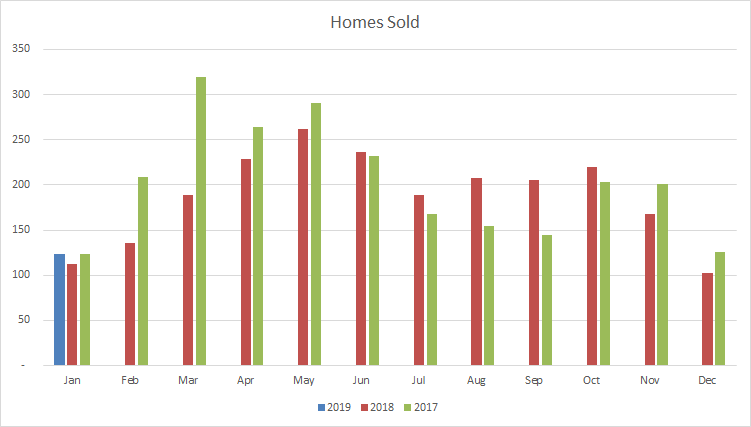
Sales activity is up slightly year over year for the month of January.
Brampton
 |
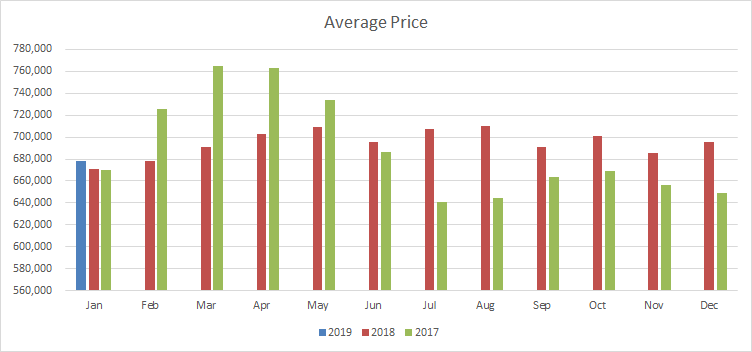 |
Brampton continues its upward trend for pricing with a 1% increase over that of January of 2018. This was driven by strong increases across semi-detached and townhouses to balance out lesser change for detached properties and condominiums.
The upward trend with pricing correlated with the tight supply which is consistent with last year. The current MOI of 3 is comparable to the 2.4 months of inventory on hand at the end of 2018.
Days on market are comparable to last year around this time. The current average is 33 days on the market with last year having presented 32 days.
We’ve seen a notable rise in the number of homes trading hands at 8% above last years reported numbers.

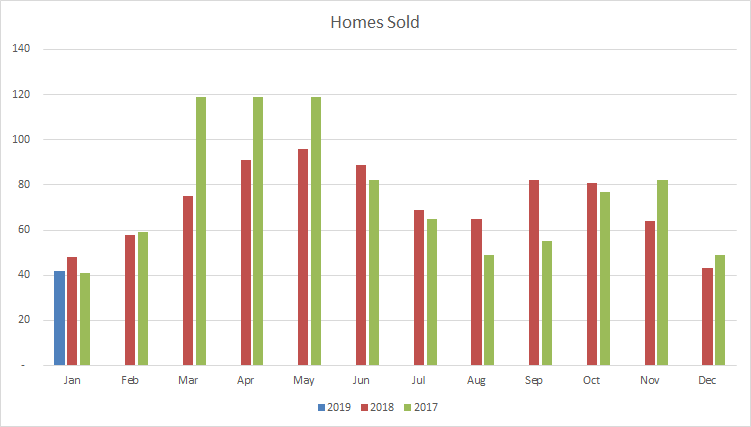
Mississauga
 |
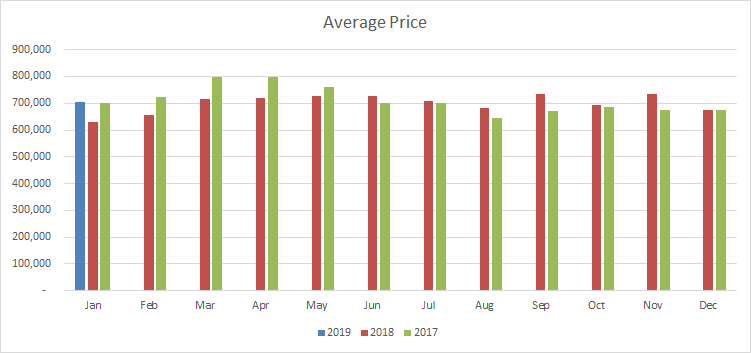 |
Mississauga market started off the year slowly with a reduction of homes sold (down by 6%); however, prices increase steadily at nearly 12%.
With consistent condo development in the downtown core we expect increased supply in future, but the current supply levels will continue to put upward pressure on pricing.
Days on market for the month dragged to 29, but that is still a year over year improvement from 2018’s 32.

Caledon
 |
 |
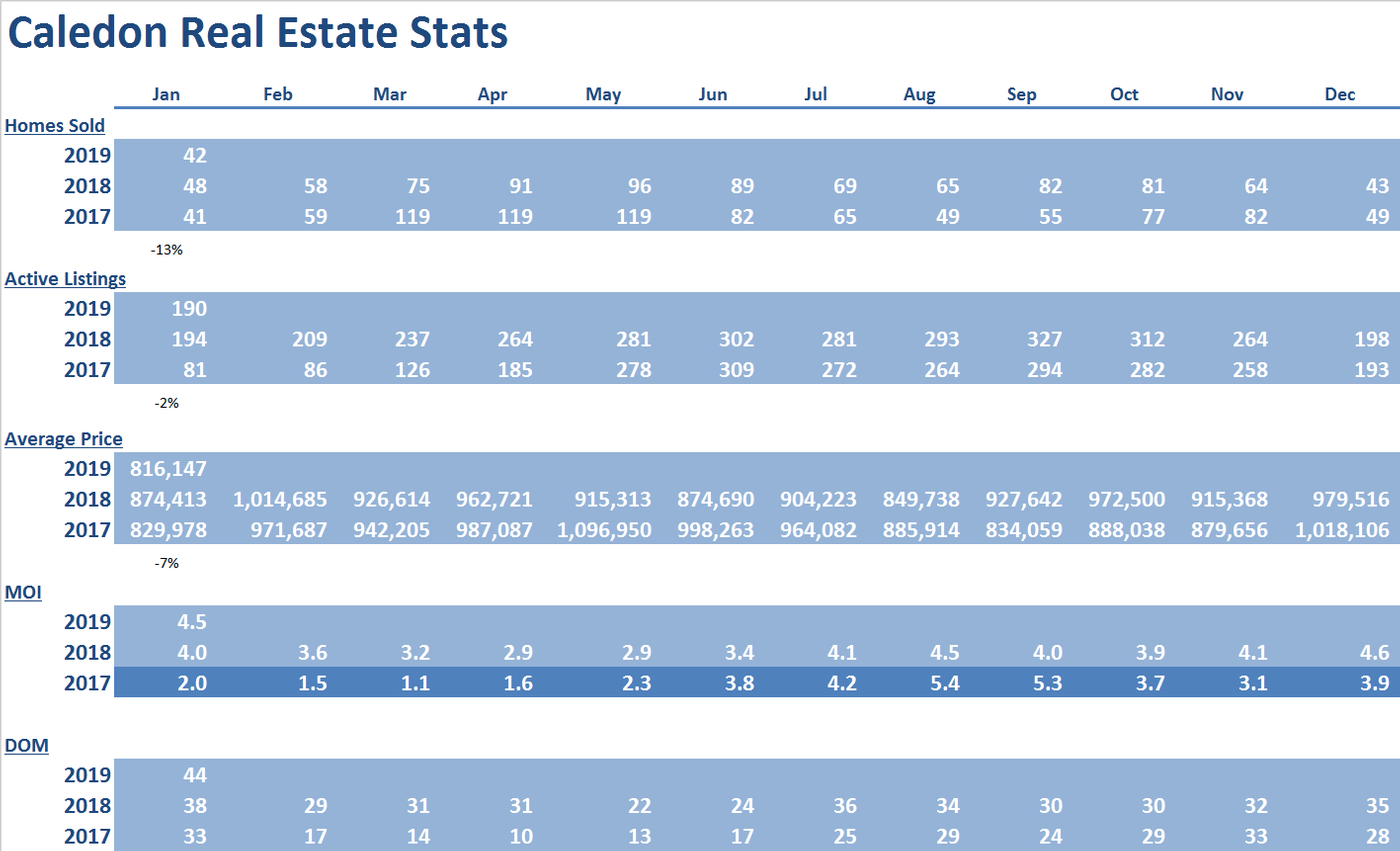
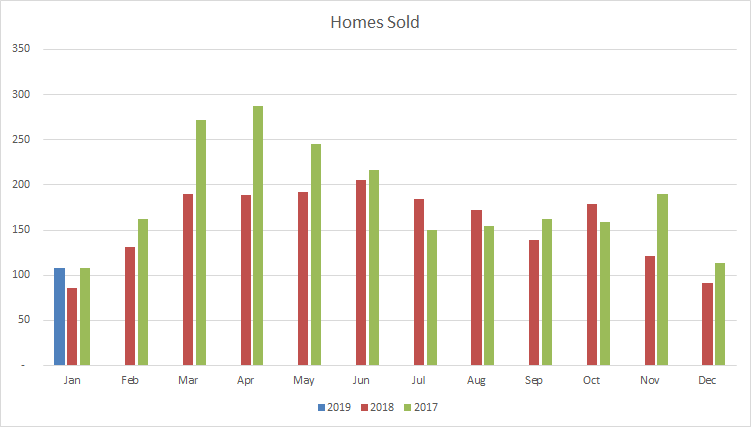
As there are very few homes traded in Caledon, and a clearer picture of the real estate market will appear as we get further into the year.
Average price of $816,147 is mostly a reflection of the mix of homes traded rather than the trend of where prices are headed.
Months of inventory on hand is slightly longer than other regions (again, due to little motivated population influx for the municipality) at 3.7 along with days on market extending to 44 days.
Milton
 |
 |
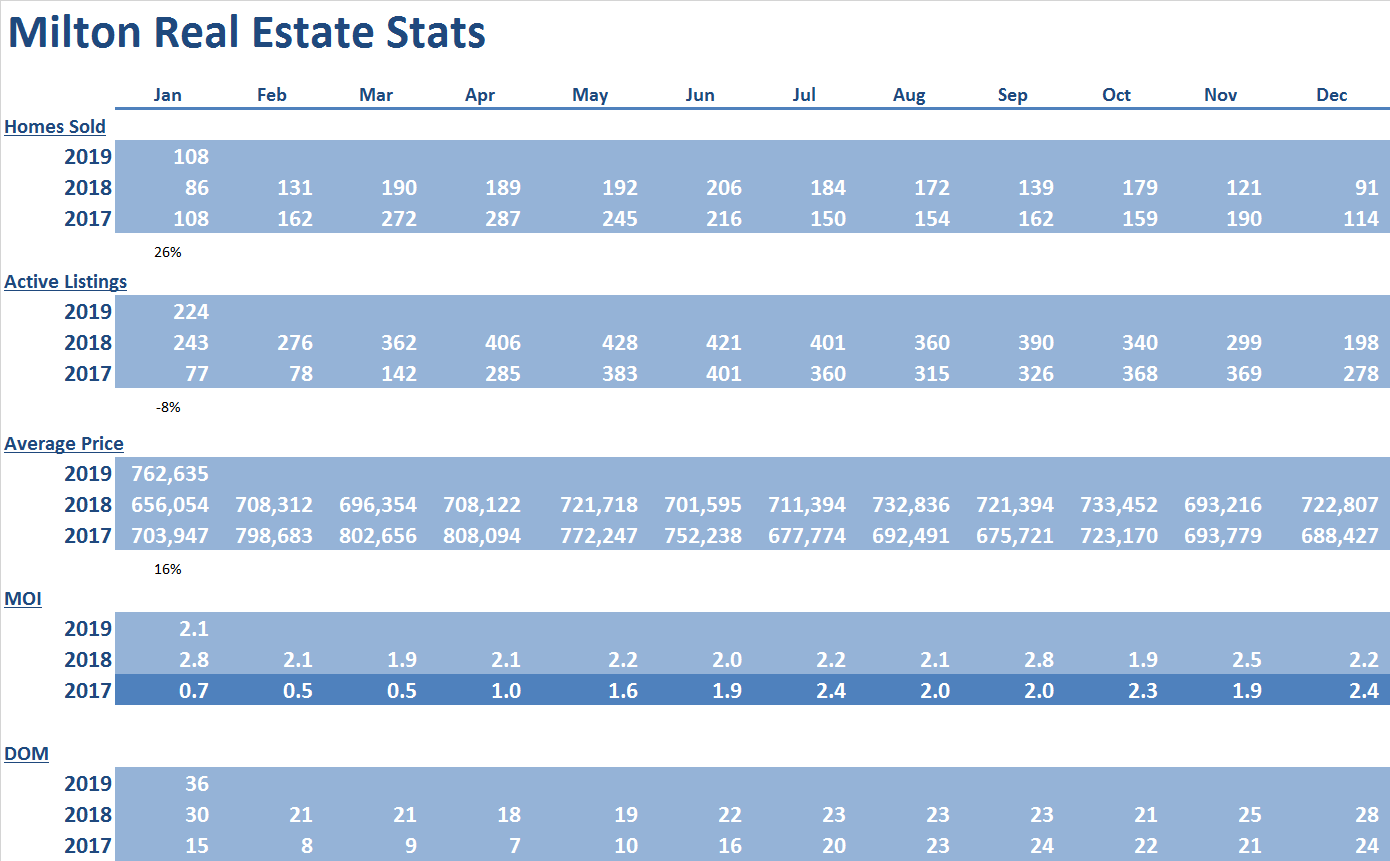
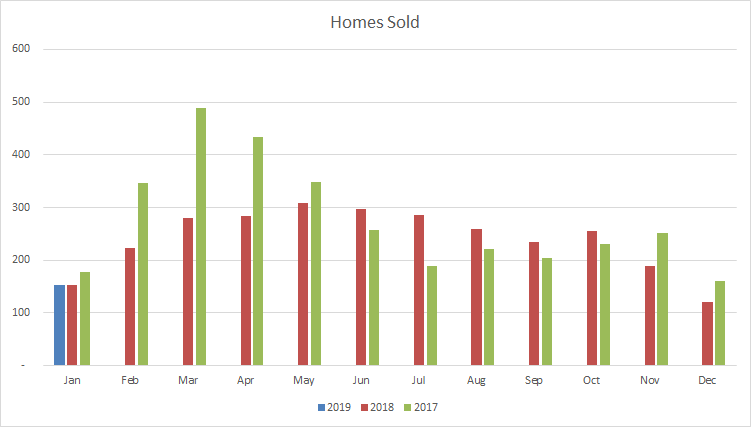
Homes traded is down slightly from last year; prices for the month are up more than 16% as Milton is establishing itself as a prime alternative to the surrounding municipalities. The tight inventory should continue to create upward pressure on average prices moving forward.
Days on market has also lulled slightly, but Milton’s market stability is reflected in January’s MOI of 2.2 this year.
Oakville
 |
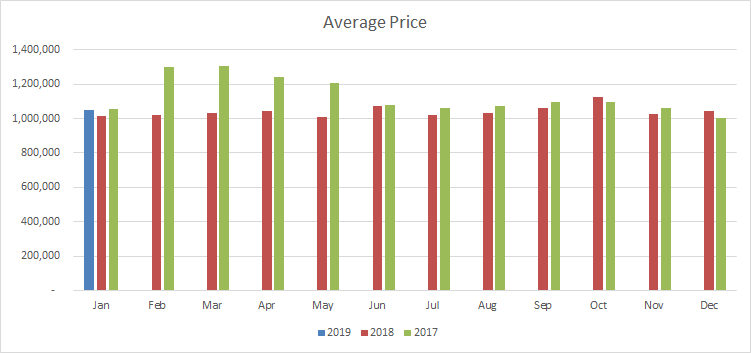 |
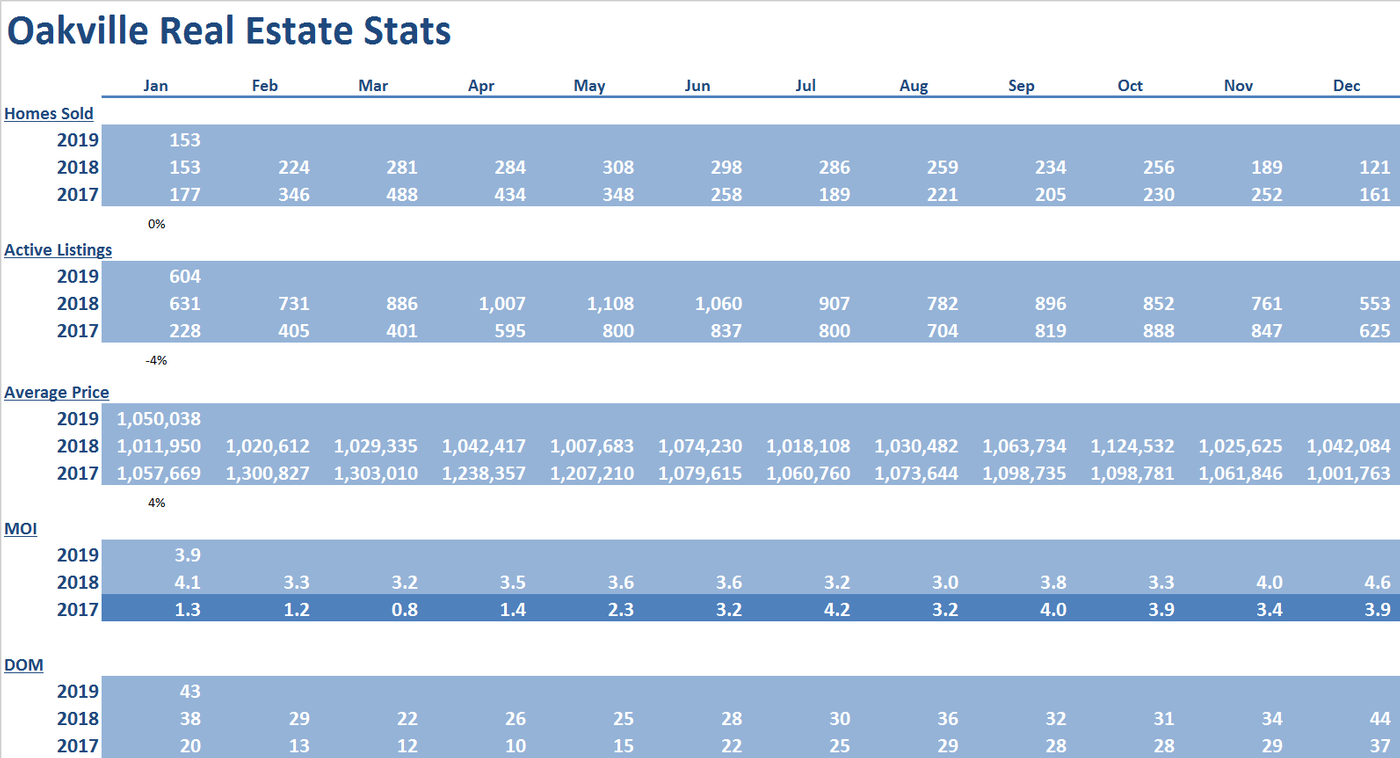
Average price of $1,050,038 is up nearly 4% from January of 2018.
Year over year sales are stable at 153, the same as last year.
Supply eased up to 3.5 months of inventory on hand inching toward balanced territory. Prices may increase a modest low single digit moving forward.
Days on market improved to 38 from 41 this time last year.
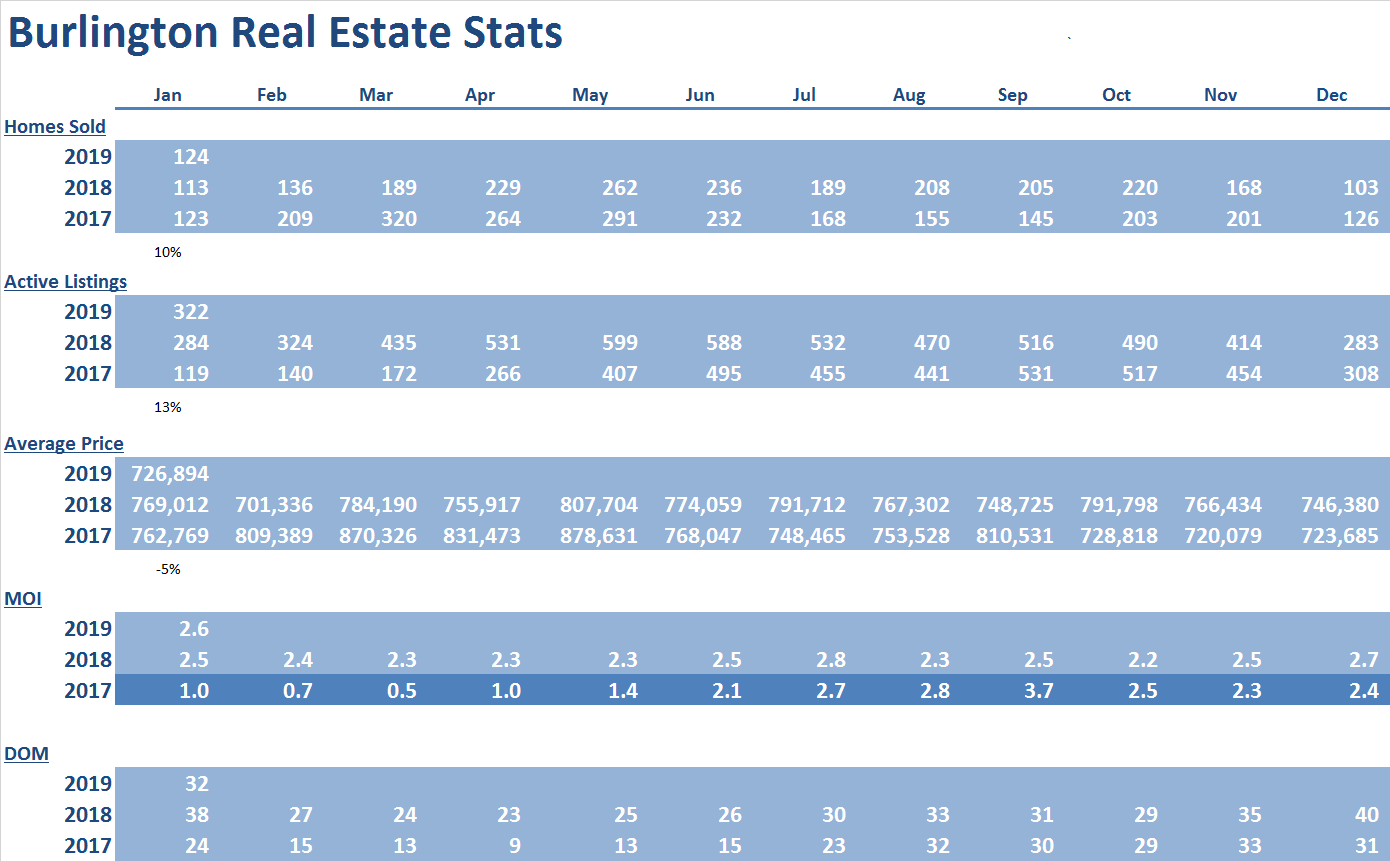
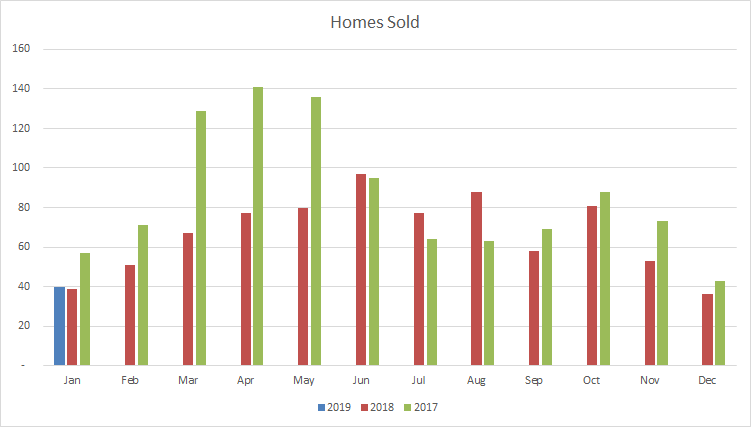
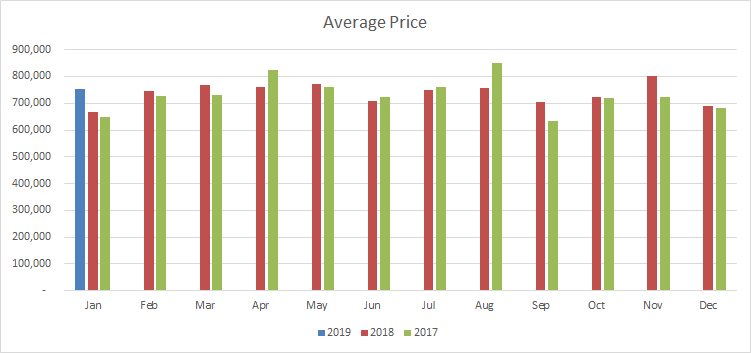
Burlington
 |
 |
Number of homes traded is off to a good start of 124 for the month (a slight uptick over last year’s 113).
Prices have taken a dip, but with 2.4 months of inventory on hand, this tight supply should put upward pressure on prices moving forward.
Days on market have improved to 32 from 38 this time last year.
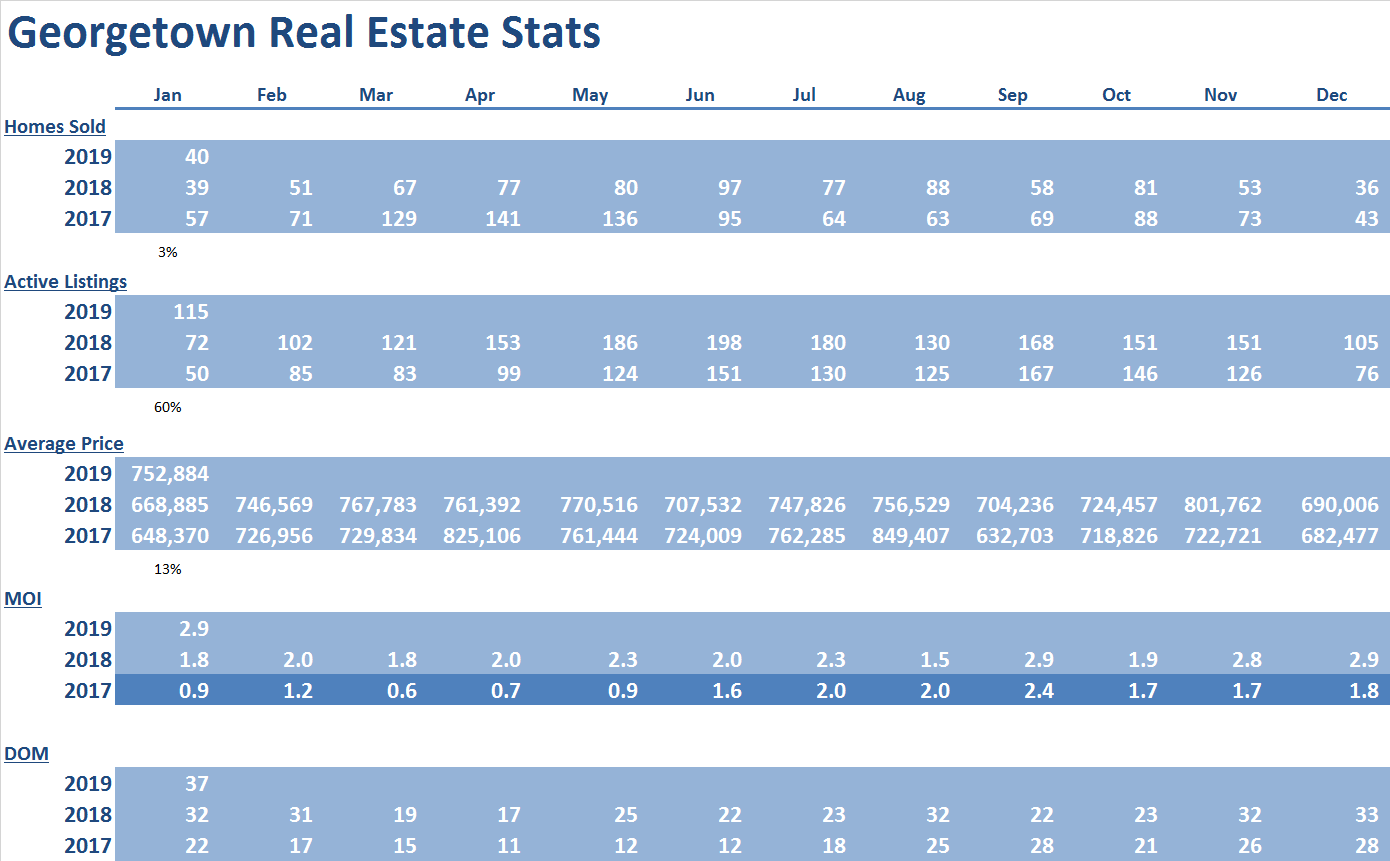
Georgetown
 |
 |
As there are very few homes traded in Georgetown, and a clearer picture of the real estate market will appear as we get further into the year.
Average price of $752,884 is mostly a reflection of the mix of homes traded rather than the trend of where prices are headed.
Supply was 2.2 months of inventory on hand and thus is in tight market territory which should result in mid-single digit price increases moving forward. This is reflected in the days on market extending to 37.
Conclusion
Months of inventory are holding steady. Average Prices and Active Listings are slightly up from this time last year. We’re looking at a balanced market with expectation for a stronger annual outcome than 2018.
*Supplementary Economic Updates:
Real estate is deemed both a lucrative and safe investment. https://www.insauga.com/a-new-report-reveals-whether-or-not-mississauga-homes-are-good-investments
Bank of Canada maintains overnight rate. https://www.bankofcanada.ca/2019/01/fad-press-release-2019-01-09/
Stats Canada Housing Price Index for January. https://www150.statcan.gc.ca/n1/daily-quotidien/190314/dq190314c-eng.htm
#200 - 10 Kingsbridge Garden Circle
Mississauga, Ontario, L5R 3K6
Office: (905/416) 456-1000
Fax: ( 905) 502-1555
391 Main St. N.
Brampton, Ontario, L6X 1N7
Office: (905/416) 456-1000
Fax: (905) 456-8116
295 Queen St. E.
Brampton, Ontario, L6W 3R1
Office: (905/416) 456-1000
Fax: (905) 456-1924
#209 - 164 Sandalwood Pky. E.
Brampton, Ontario, L6Z 3S4
Office: (905/416) 456-1000
Fax: (905) 840-2344
New Listings
Open Houses
Homes For Lease
The RE/MAX Collection
Commerical Properties
Neighbourhood Watcher™
Neighbourhood Solds
Preferred Client Registration
Find My Dream Home
What's My Home Worth?
Mortgage Pre-Approval
Mortgage Calculator
Land Transfer Tax
The information contained on this site is based in whole or in part on information that is provided by members of The Canadian Real Estate Association, who are responsible for its accuracy. CREA reproduces and distributes this information as a service for its members and assumes no responsibility for its accuracy.
This website is operated by a brokerage or salesperson who is a member of The Canadian Real Estate Association.
The listing content on this website is protected by copyright and other laws, and is intended solely for the private, non-commercial use by individuals. Any other reproduction, distribution or use of the content, in whole or in part, is specifically forbidden. The prohibited uses include commercial use, "screen scraping", "database scraping", and any other activity intended to collect, store, reorganize or manipulate data on the pages produced by or displayed on this website.