GTA REAL ESTATE MARKET EXPECTED TO STRENGTHEN IN 2019
January 18, 2019 Real Estate

Most of us had expected a slower start to 2018 compared to the record setting high sales count and price appreciation reported in the winter and early spring of 2017. During the second half of 2018, many prospective home buyers came to terms with the psychological impact of the Fair Housing Plan, and some also had to reevaluate their plans due to the new OFSI-mandated mortgage stress test guidelines and generally higher borrowing costs. As a result the second half of 2018 saw increasing prices as well as increasing number of transactions when compared to 2017.
This strengthening should continue into 2019 as this is a federal election year and contrary to the prevailing opinions of economists and prognosticators during 2018, interest rates may actually be decreasing in 2019. In fact RBC cut its 5-year fixed mortgage rate on January 16th and other banks are expected to follow. The resulting demand should continue to push prices upward, however due to affordability challenges, appreciation should be a low single digit range moving forward.
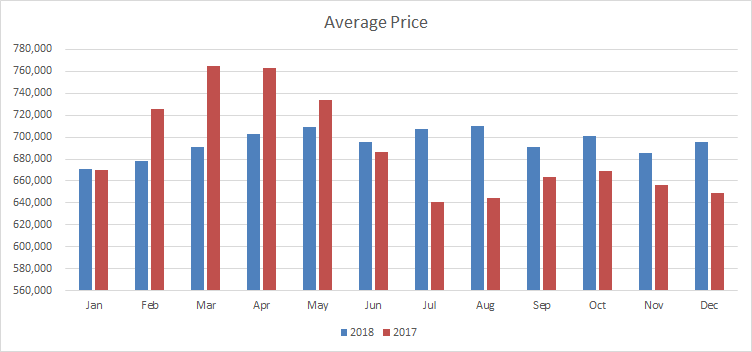
Home prices continued their upward trend as average prices rose 2.1% in December 2018 compared to December 2017.

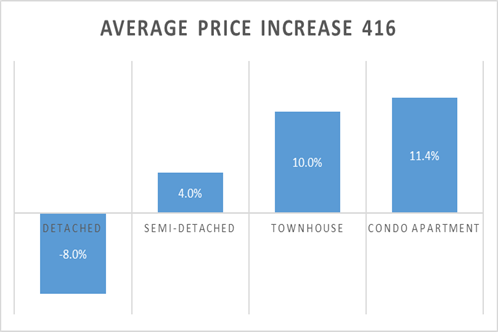
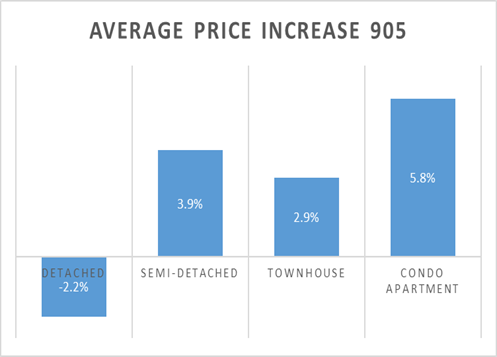
The increase in prices was driven by the condo, townhome and semi-detached segments which increased significantly in December 2017 compared to December 2017, while detached homes decreased. This price changes varied between the 416 and 905. Appreciation of the condo and townhome market was dramatically higher in the 416 compared to the 905, while the decrease in the detached market was dramatically higher as well.
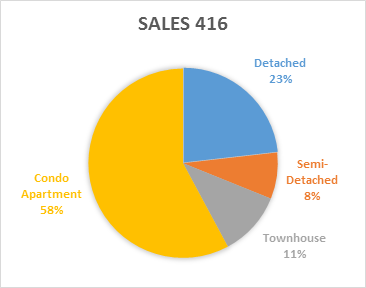
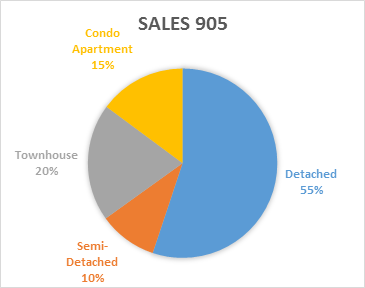
Due to the relative affordability, the greatest number of transactions are for condos in the 416. Also for relative affordability, home purchasers for detached are choosing to move to 905 in relatively larger numbers.
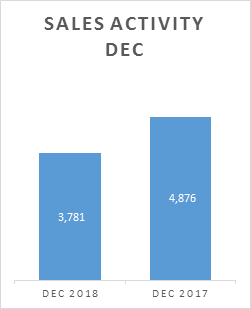
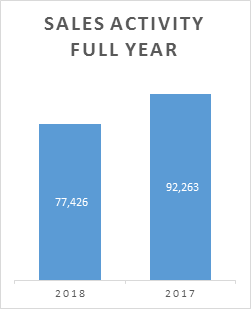
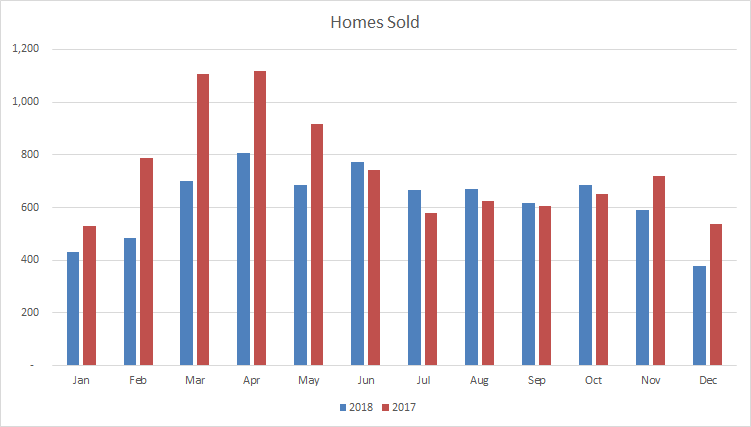
Sales activity for the second half of the year has grown in every month except for November and December of 2018 as November 2017 had an artificial bump due to the looming OSFI-mandated stress test at the end of last year. As a result sales activity fell by 22.5% in December of 2018 compared to December 2017. The increase in sales activity for most of the second half of the year was not enough to make up for the decreases during the first half of the year and as a result, activity was down by 16.1% for the full year 2018 compared to the full year 2017.
Supply remained tight at approximately 2.7 months of inventory, resulting in 2.1% price increase mentioned above (industry insiders view anything under 4 months as tight supply and a sellers’ market, 4 to 6 months as balanced market and above 6 as a buyers’ market). In fact, prices have been higher year over year for the seventh consecutive month.
The key factors leading to the increasing prices continues to be the combination of strong employment rate, historically low interest rates, and strong population growth*.
Brampton
 |
 |
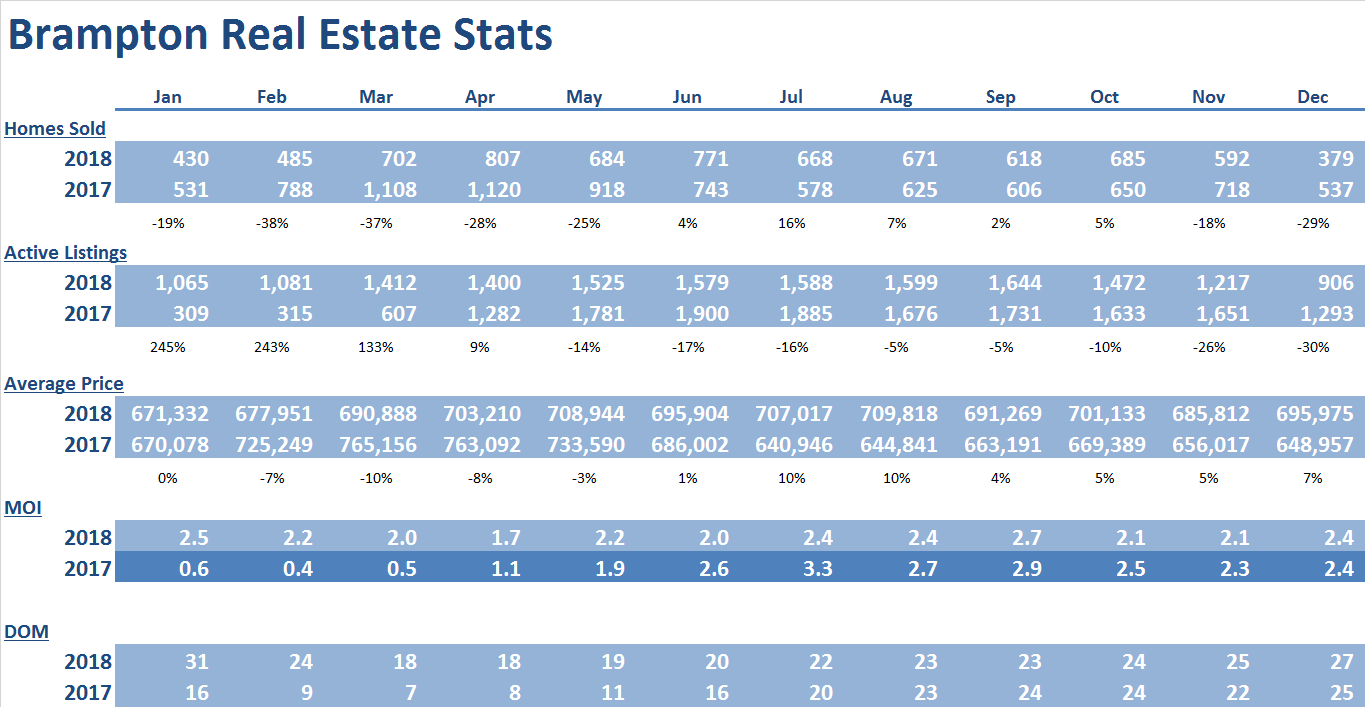
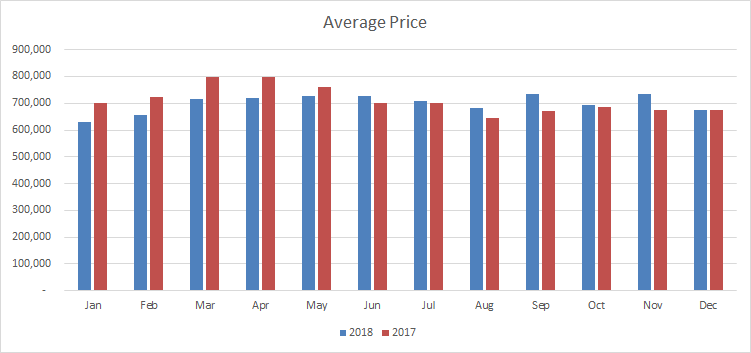
December was the 7th consecutive month with year-over-year price increases and there have been 8 monthly price increase since December of 2017. Prices have risen 7% since the end of 2017. This was driven by strong increases across all housing types. The December 2018 average price is down by only 9% from the all-time high set in March of 2017.
Supply remains tight at 2.4 months of inventory on hand. This tight supply will continue to create upward pressure on average prices moving forward.
Days on market have remained low at 27, which represents a slight improvement from the beginning of the year, when days on market reached 31.
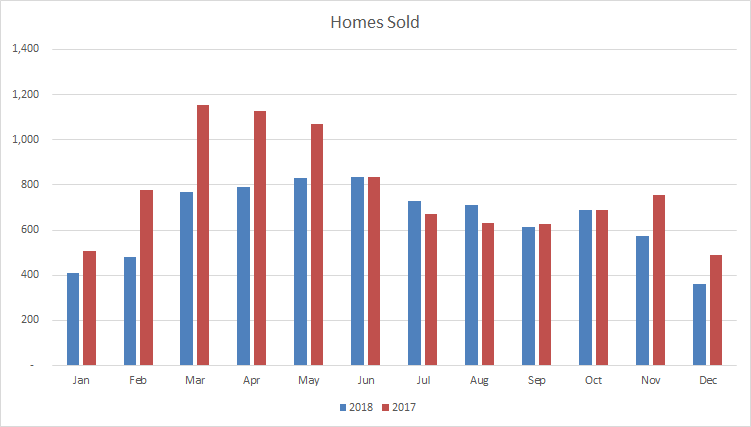
December represents the second month of the second half of the year where sales activity fell compared to the previous year as December 2017 had an artificial bump due to the looming OSFI-mandated stress test at the end of last year. As a result, sales activity fell by 29% in December 2018 compared to December 2017.
Year-to-date sales in Brampton are only 16% lower than 2017, as sales increases for most of the second half of the year have significantly offset the decreases experienced during the beginning of the year.
Mississauga
 |
 |
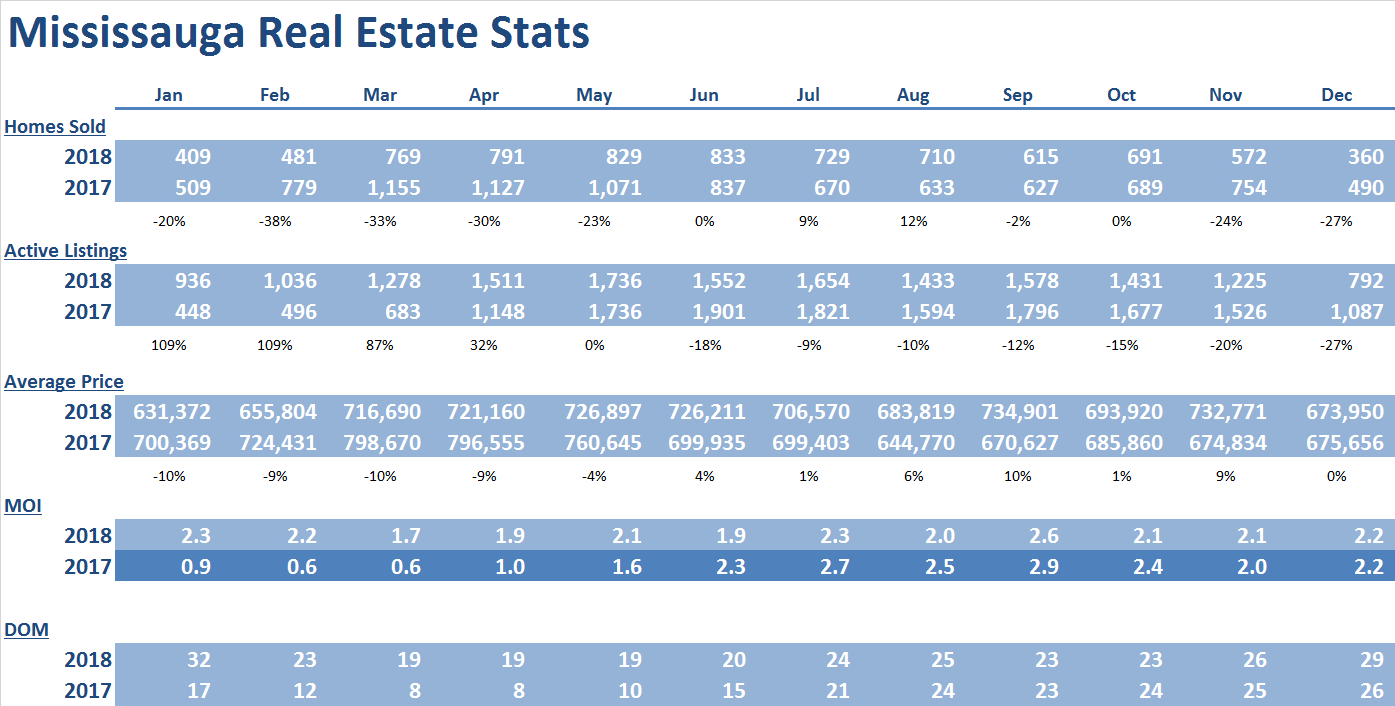
December was the first month of the second half of the year where prices didn’t increase compared to 2017. Prices were relatively unchanged at just below $675,000
Supply remains very tight at 2.2 months of inventory on hand at the end of December. This supply constraint should create upward pressure on average price moving forward.
Days on market increased slightly to 29 for the month, and represents a slight improvement from the 32 days on market experienced earlier in the year.
Although number of homes sold have been either higher or relatively the same for each month of the second half of the year, there was a significant drop in number of home sales for November and December of 2018 compared to the same months of 2017 as November and December 2017 had an artificial bump due to the looming OSFI-mandated stress test at the end of last year.
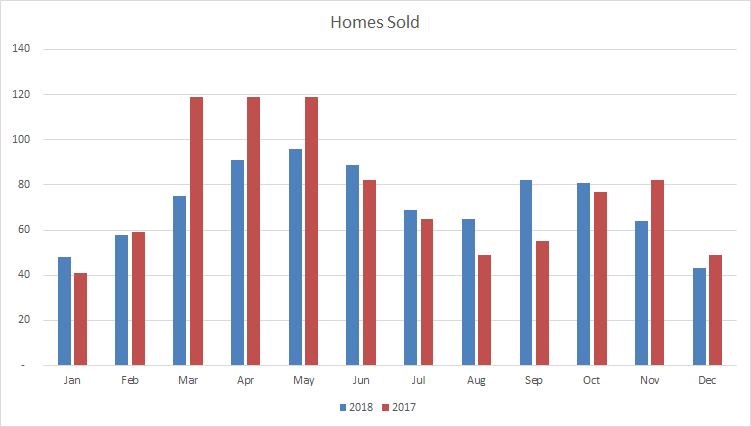
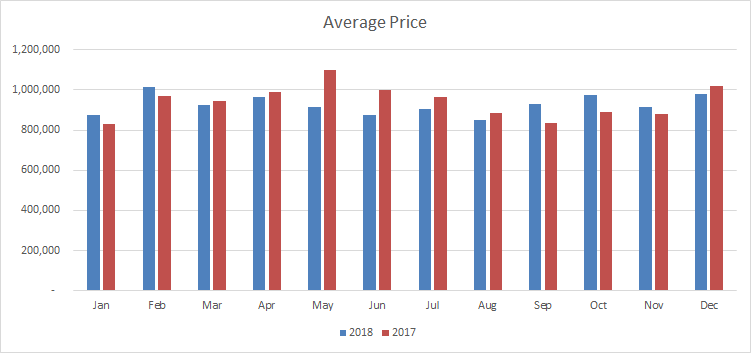
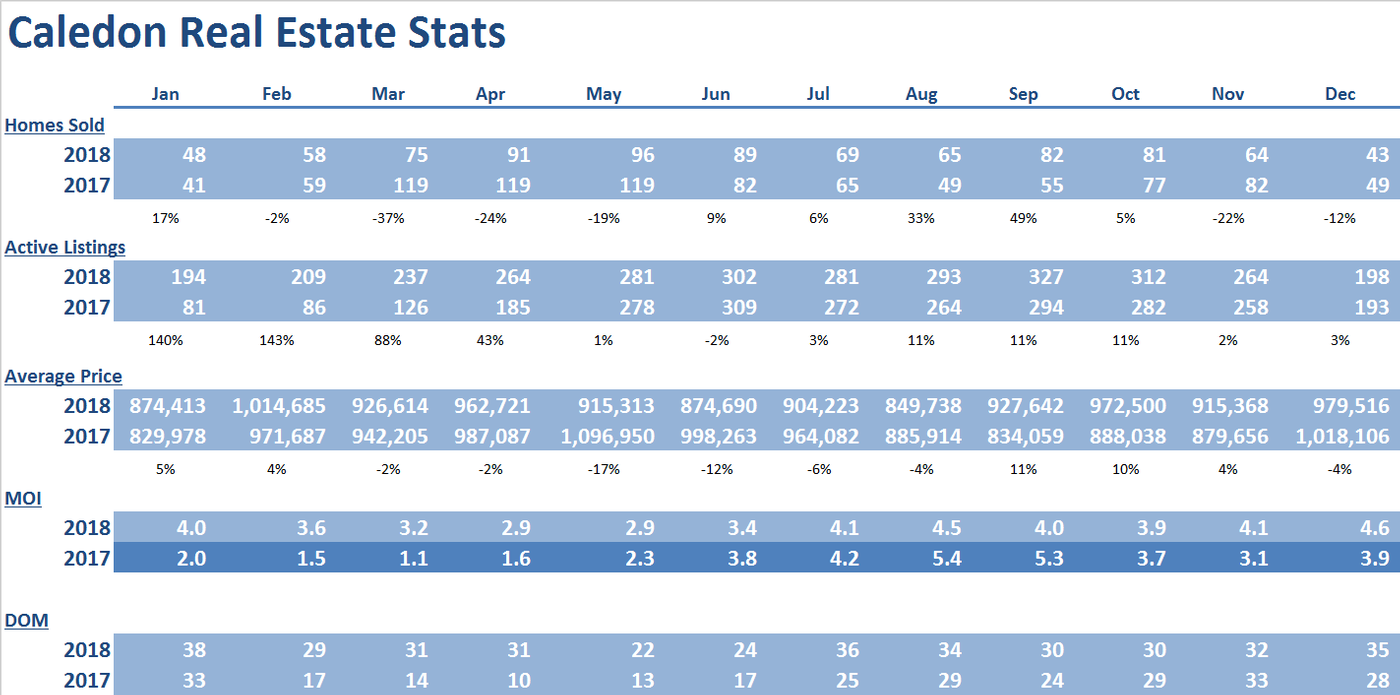
Caledon
 |
 |
Year over year sales increased for five of the last seven months of 2018 when compared to 2017. As a result of the surge in sales activity during the second half of the year, full year sales were only down 6% from 2017.
The average price in December of $979,516 is down 4% from December of 2017.
Supply eased slightly to 4.6 months of inventory on hand and thus is in balanced market territory which should result in low single digit price increases moving forward.
Days on market increased to 35 days and has improved slightly from the beginning of the year when days on market was 38.
Milton
 |
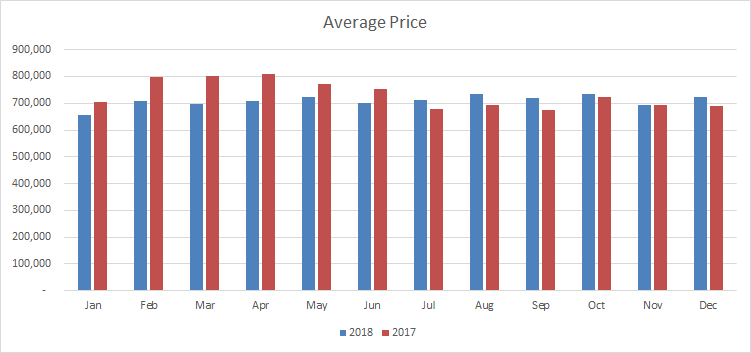 |
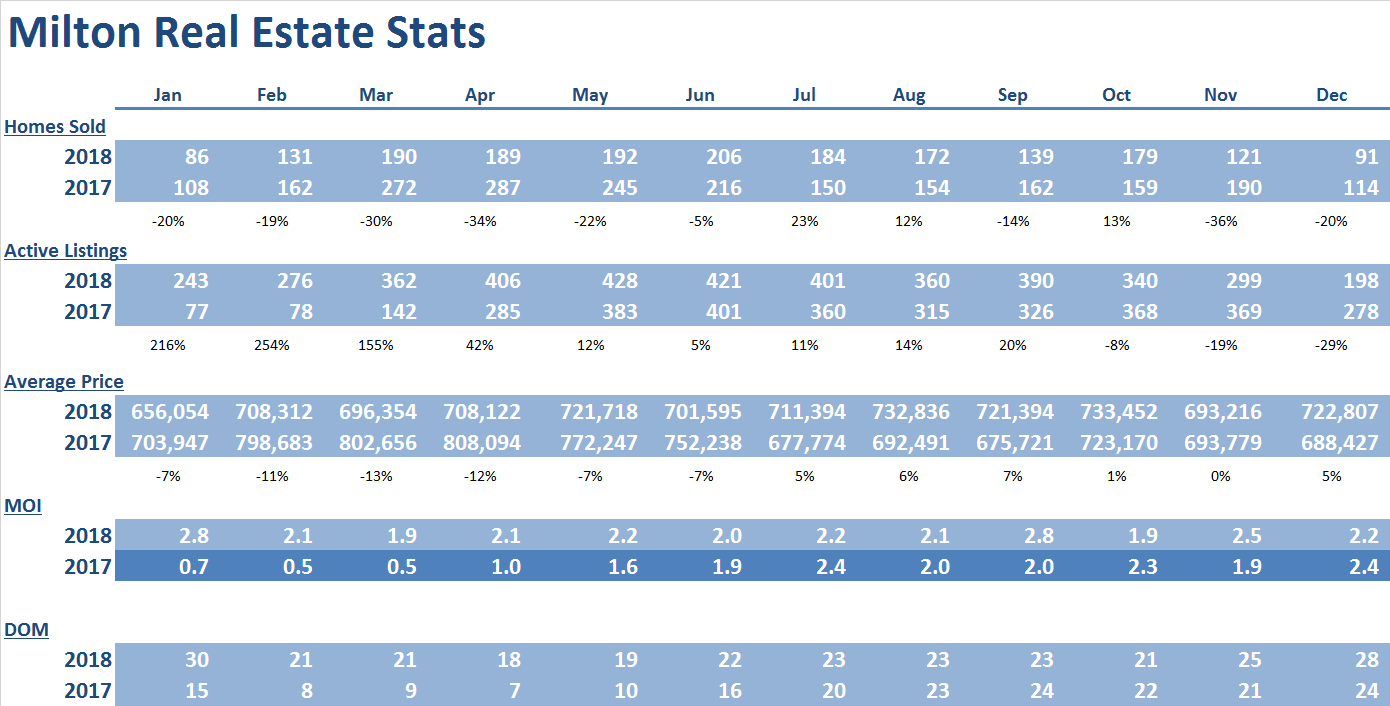
Prices in December 2018 increased 5% over December of 2017 at approximately $723k.
Supply tightened up to 2.2 months of inventory, and thus should continue to create upward pressure on average prices moving forward.
Days on market eased to 28 which represents a slight improvement from the beginning of the year, when days on market reached 30.
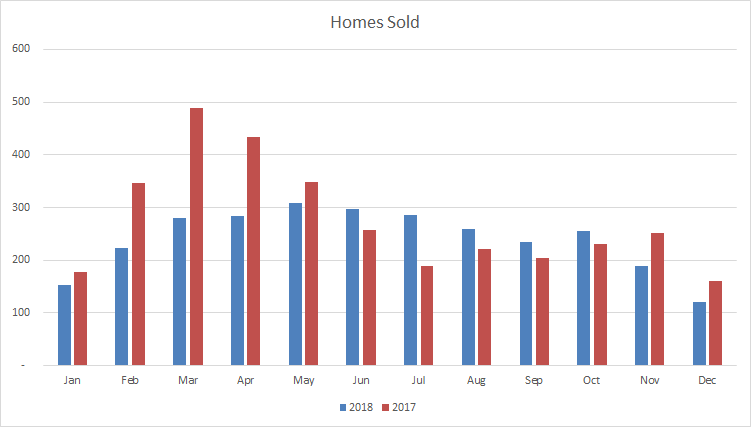
Year-to-date sales in Milton are only 15% lower than 2017, as sales increased 3 of the past six months, offsetting the decreases experienced during the beginning of the year (note: during March and April of 2018, Milton experienced unit sales decreases of 30% and 34% year-over-year, respectively).
Oakville
 |
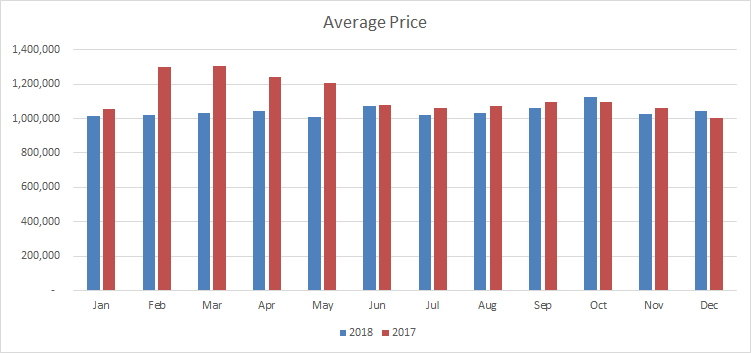 |
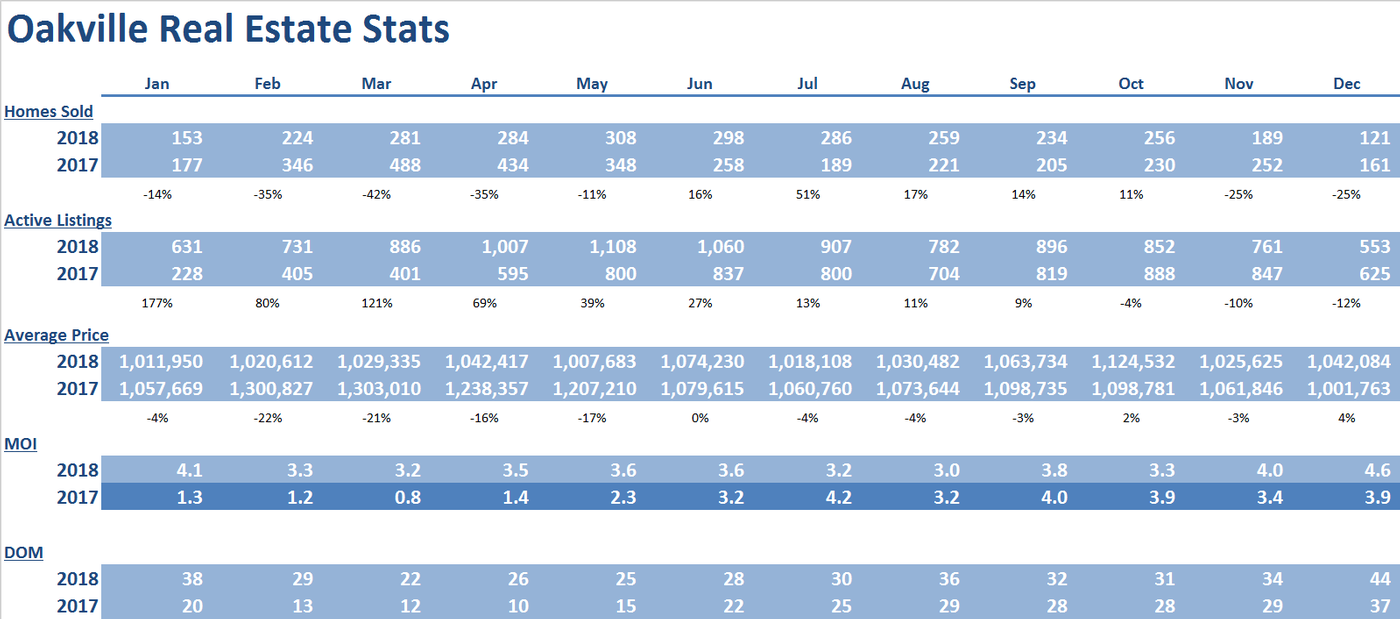
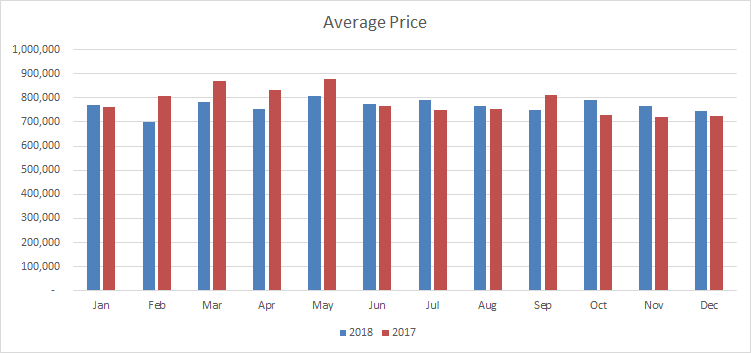
Average price of $1,042,084 is up 4% from December of 2017.
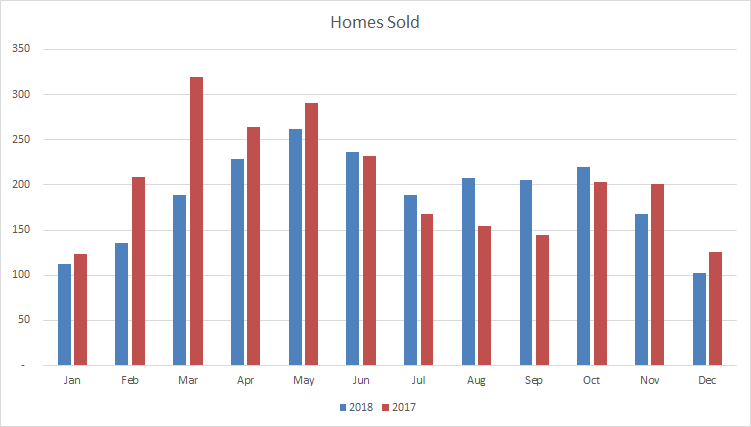
Year over year sales increased for five of the last 7 months of 2018, making up for significant reductions in year over years sales transactions experienced at the beginning of the year. As a result, sales year to date are only down 13% from 2017.
Supply eased up slightly to 4.6 months of inventory on hand and is in balanced territory and as a result prices should increase a modest low digit moving forward.
Days on market increased to 44.
Burlington
 |
 |
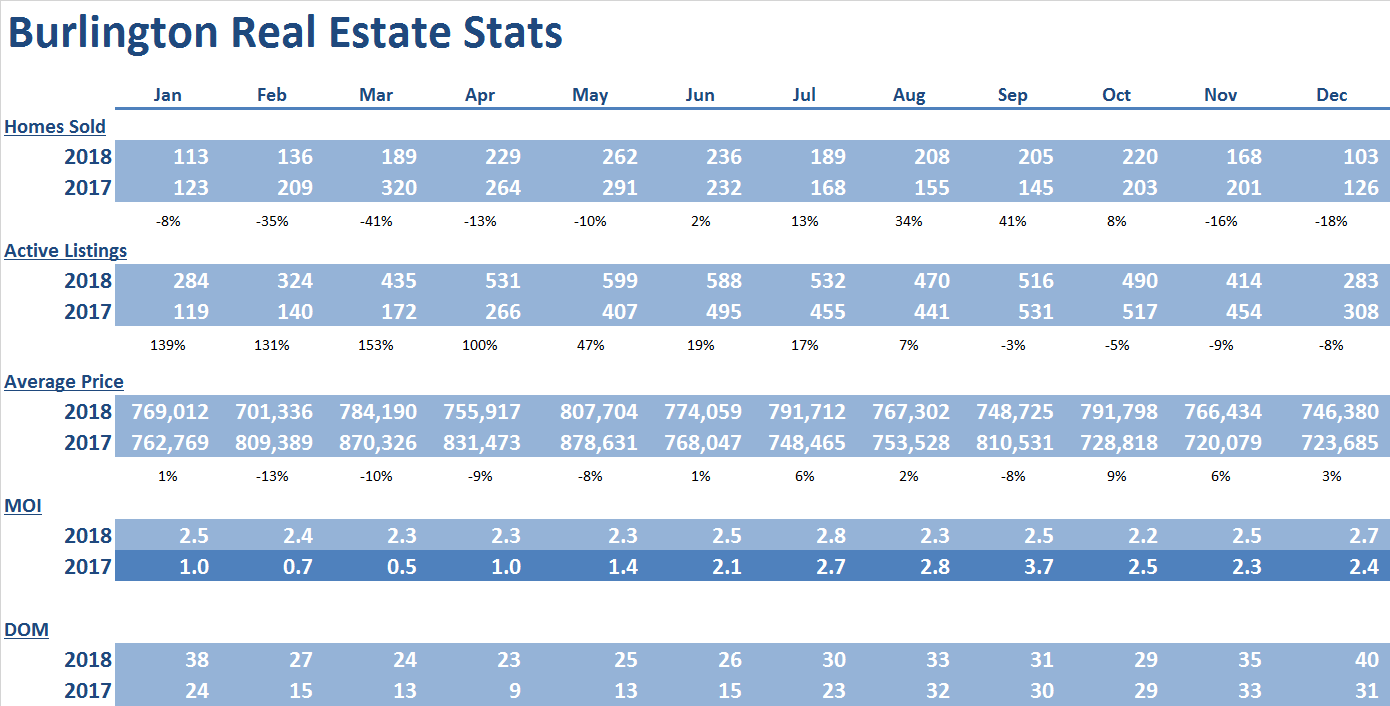
Year over year sales increased for five of the last 7 months of 2018. As a result, unit sales are only 7% lower than 2017.
Prices have increased five of the last 7 months of 2018 on a year-over-year basis. Prices ended the year 3% higher than December 2017.
Supply eased slightly but remains at a tight 2.7 months of inventory on hand. This tight supply should put upward pressure on prices moving forward.
Days on market have increased to 40.
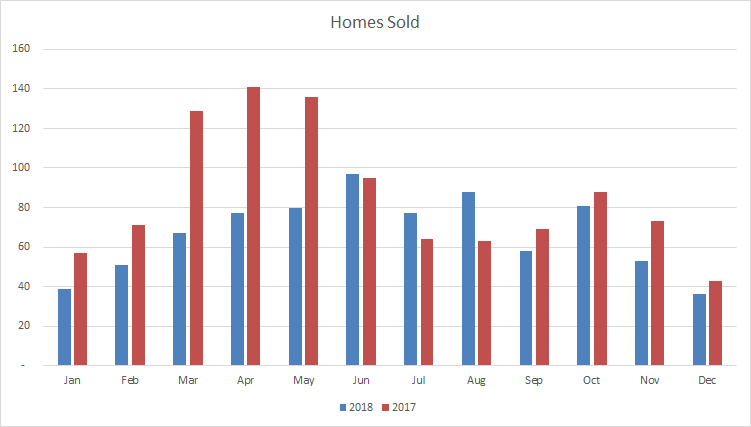
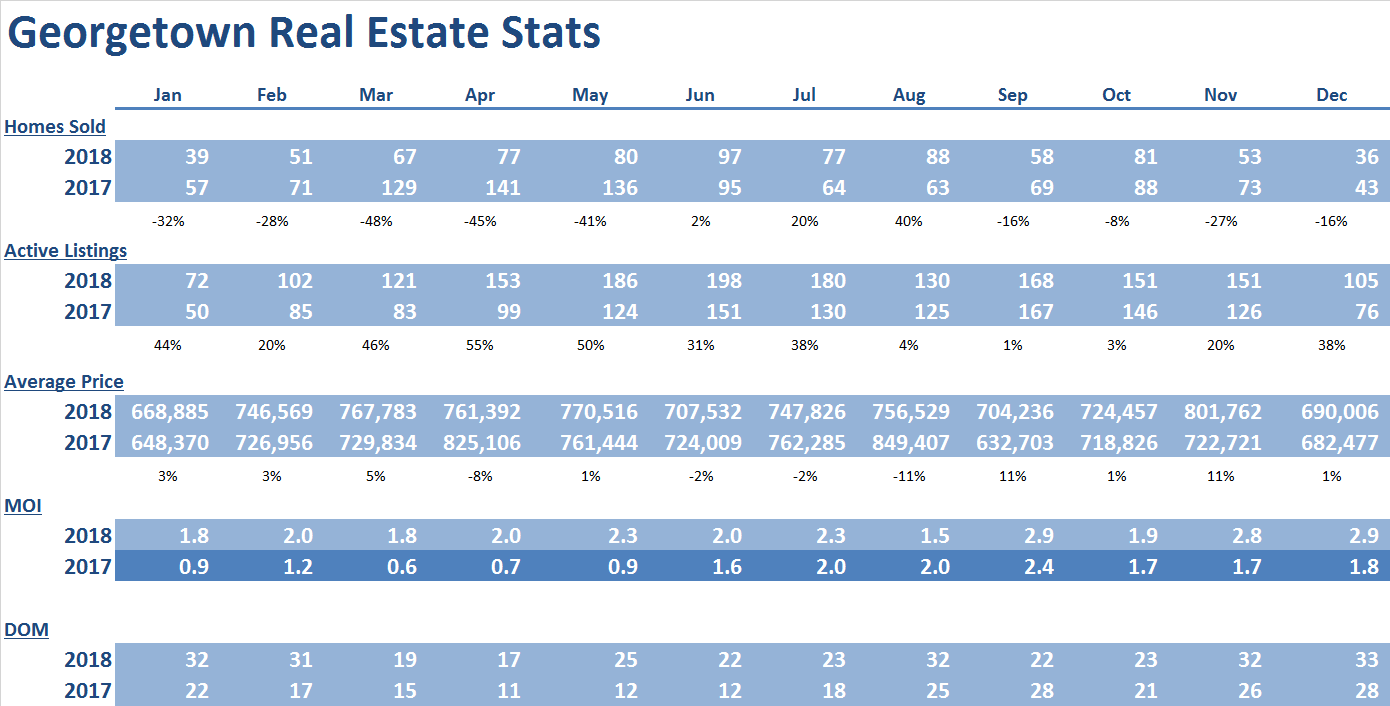
Georgetown
 |
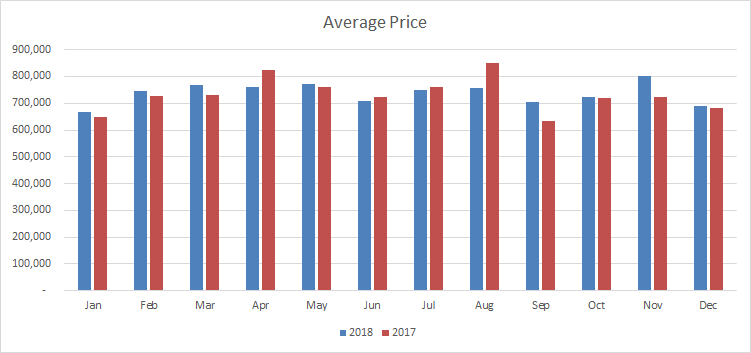 |
December average home price of $690,006 is 1% up from the December of 2017.
Year over year sales 22% compared to 2017, which represents a dramatic improvement from the beginning of the year when year-over-year sales were down as much as 48% (February).
Supply increased slightly to 2.9 months of inventory on hand. This tight supply should continue to put upward pressure on prices moving forward.
Days on market increased to 33 and remains consistent with the beginning of the year.
Conclusion
Upward pressure on home prices in the GTA will continue as available housing in most parts of the GTA remains in a short supply coupled with the fact that interest rates have started to decrease.
*Some Key Economic indicators for a healthy real estate forecast:
Peel Region expected to grow by 500,000 people in next 2 decades https://www.insauga.com/500000-new-residents-expected-in-mississauga-and-surrounding-cities-over-next-two-decades
BOC holds rate Jan 9 2019 https://www.bankofcanada.ca/2019/01/fad-press-release-2019-01-09/
Key economic indicators – Statistics Canada https://www.statcan.gc.ca/eng/start
Consumer confidence index https://www.conference-board.org/data/consumerconfidence.cfm
#200 - 10 Kingsbridge Garden Circle
Mississauga, Ontario, L5R 3K6
Office: (905/416) 456-1000
Fax: ( 905) 502-1555
391 Main St. N.
Brampton, Ontario, L6X 1N7
Office: (905/416) 456-1000
Fax: (905) 456-8116
295 Queen St. E.
Brampton, Ontario, L6W 3R1
Office: (905/416) 456-1000
Fax: (905) 456-1924
#209 - 164 Sandalwood Pky. E.
Brampton, Ontario, L6Z 3S4
Office: (905/416) 456-1000
Fax: (905) 840-2344
New Listings
Open Houses
Homes For Lease
The RE/MAX Collection
Commerical Properties
Neighbourhood Watcher™
Neighbourhood Solds
Preferred Client Registration
Find My Dream Home
What's My Home Worth?
Mortgage Pre-Approval
Mortgage Calculator
Land Transfer Tax
The information contained on this site is based in whole or in part on information that is provided by members of The Canadian Real Estate Association, who are responsible for its accuracy. CREA reproduces and distributes this information as a service for its members and assumes no responsibility for its accuracy.
This website is operated by a brokerage or salesperson who is a member of The Canadian Real Estate Association.
The listing content on this website is protected by copyright and other laws, and is intended solely for the private, non-commercial use by individuals. Any other reproduction, distribution or use of the content, in whole or in part, is specifically forbidden. The prohibited uses include commercial use, "screen scraping", "database scraping", and any other activity intended to collect, store, reorganize or manipulate data on the pages produced by or displayed on this website.