GTA REAL ESTATE REMAINS A SOLID LONG-TERM INVESTMENT
November 15, 2018 Real Estate

Sales continue to grow while active listings continue to fall, creating a tightening of supply in the Greater Toronto Area. With this tighter supply, prices continue their upward climb. In fact, prices have been higher year over year for the fifth consecutive month. Prices are also up for 7 of the past 10 months.
Torontonians have come to the realization that waiting any longer will create a two-pronged challenge – increasing home prices and increasing borrowing costs – the Bank of Canada (BOC) increased interest rates by a quarter point five times since July 12, 2017. As a result, many understand that now is the time to buy.
The key factors leading to the increasing prices continues to be the combination of strong employment rate, historically low interest rates, and strong population growth*.
Brampton
 |
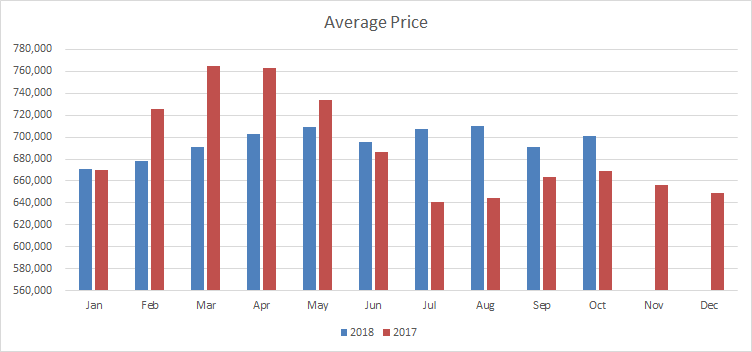 |
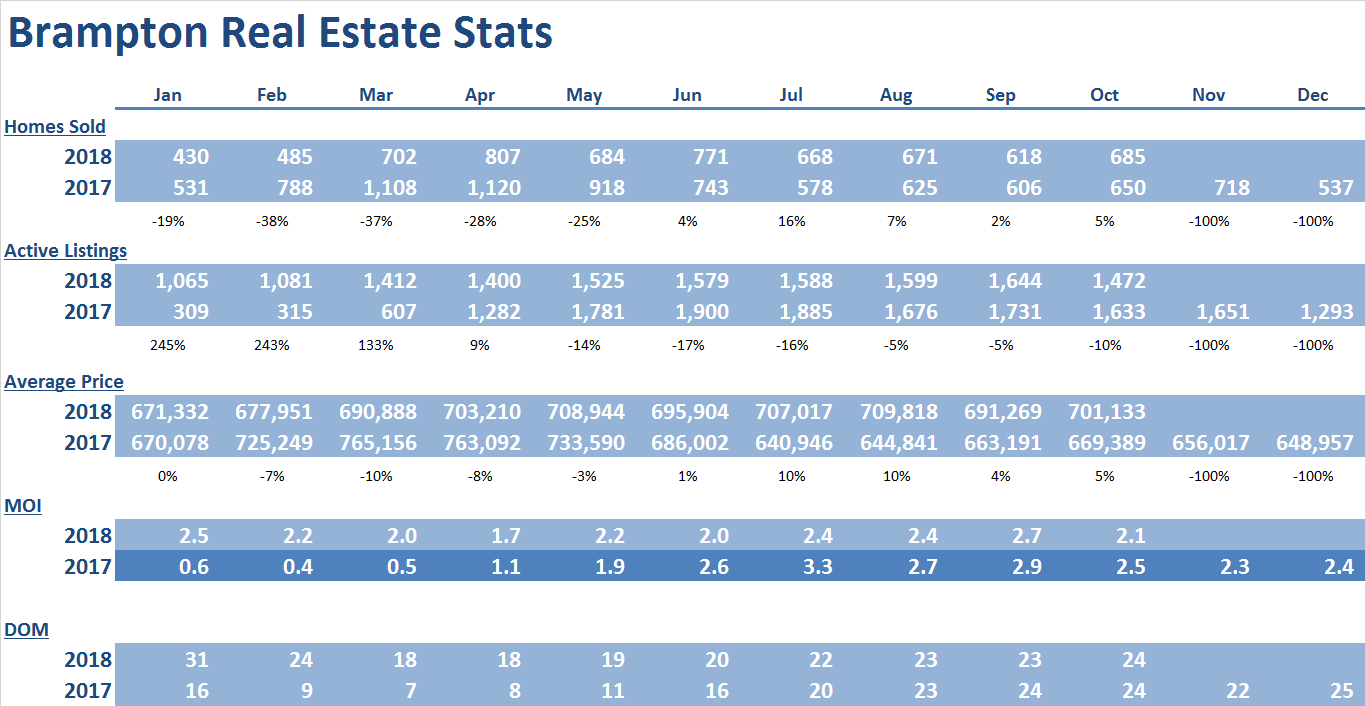
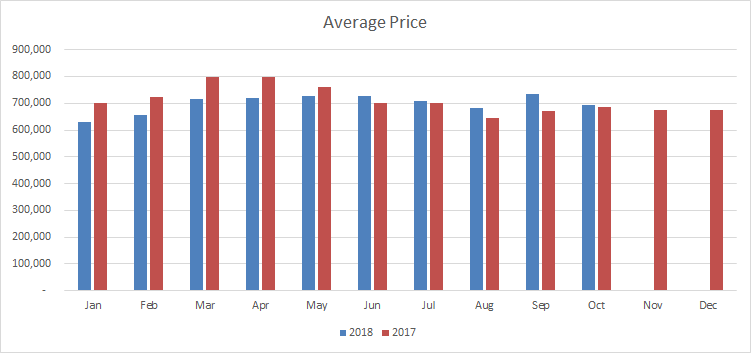
October was the 5th consecutive month with year-over-year price increases and there have been 8 monthly price increase since December of 2017. Prices have risen 8% since the end of 2017. Prices in October 2018 rose 5% compared to October of 2017 to $701,133. This was driven by strong increases across all housing types. The October 2018 average price is down by only 8% from the all-time high set in March of 2017.
Supply tightened from 2.7 months of inventory on hand in September to just 2.1 in October. This tight supply will continue to create upward pressure on average prices moving forward.
Days on market have remained low at 24, which represents a significant improvement from the beginning of the year, when days on market reached 31.
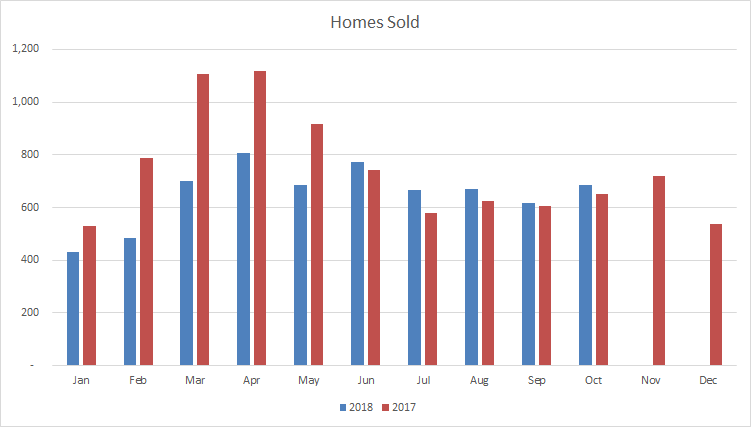
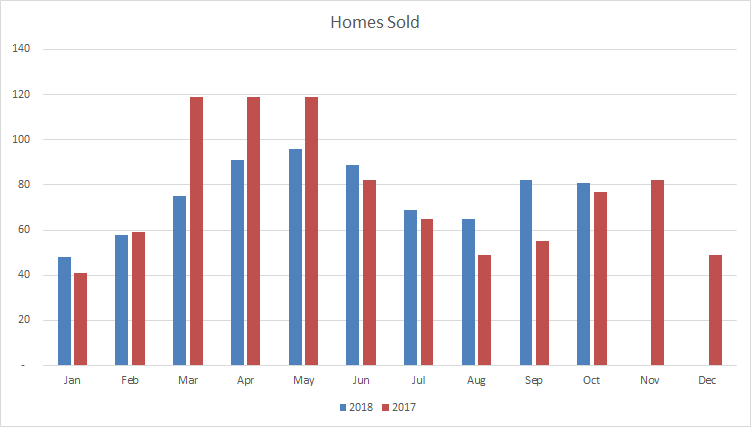
October represents the fifth consecutive month of year-over-year sales increases, rising 5% compared to the same month in 2017 to 685 homes. Year-to-date sales in Brampton are only 15% lower than 2017, as sales increases for the past five months have significantly offset the decreases experienced during the beginning of the year (note: during February and March of 2018, Brampton experienced unit sales decreases of 38% and 37% year-over-year, respectively).
Mississauga
 |
 |
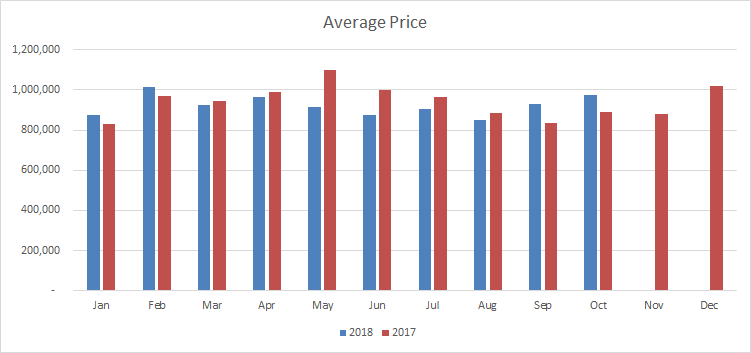
October was the fifth consecutive month of the year-over-year prices increases and prices have been up for 5 of the past 10 months since December of 2017. Prices have risen 3% since the end of 2017. Prices in October 2018 rose 1% to $693,920 compared to October of 2017.
The September 2018 average price is down by only 13% from the all-time high set in March of 2017.
Supply remains very tight and has decreased from 2.6 months of inventory in September to 2.1 in October as active listings have been decreasing dramatically, while sales have been trending up for the past 5 months. This supply constraint will continue to create upward pressure on average price moving forward.
Days on market of remained at 23 for the month, represents a significant improvement from the 32 days on market experienced earlier in the year.
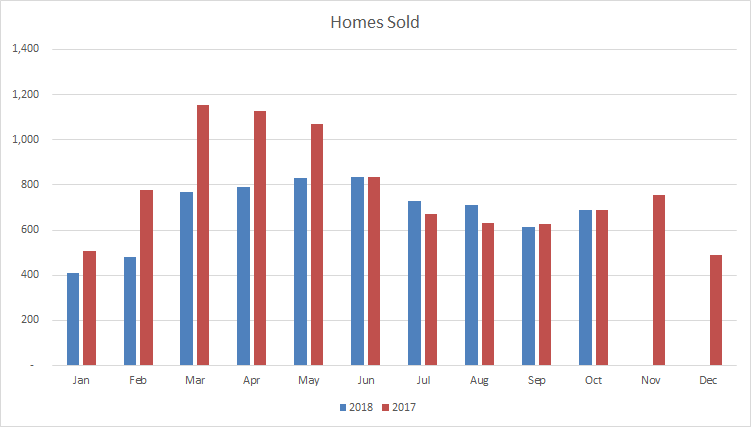
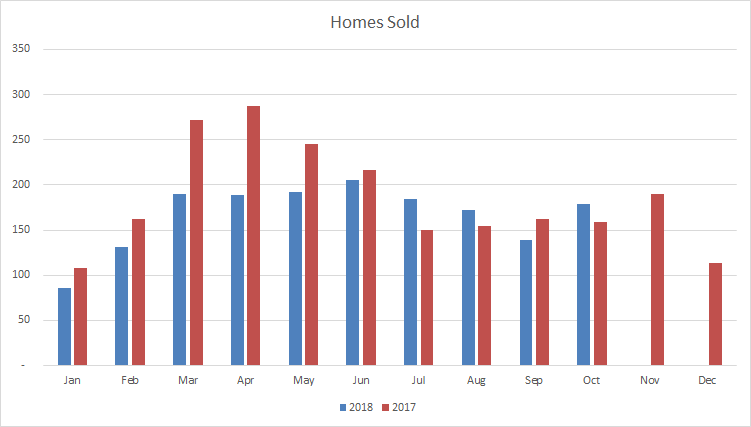
As unit sales for the past 5 months have been higher than 2017, this increased activity has significantly offset the decreases experienced during the beginning of the year (note: during February and March of 2018, Mississauga experienced unit sales decreases of 38% and 33% year-over-year, respectively). As a result sales year to date are only down 15% from the all-time high set in 2017.

Caledon
 |
 |
Year over year sales increased for five consecutive months, rising a dramatic 8% over October of 2017. As a result of the surge in sales activity during the past five months, year-to-date sales are only down 4% from 2017.
The average price in September of $972,500 is up 11% from October of 2017.
Supply tightened further to 3.9 months of inventory on hand from 4 months in September and 4.5 months in August.
Days on market remained at 30 days and has improved dramatically from the beginning of the year when days on market was 38.

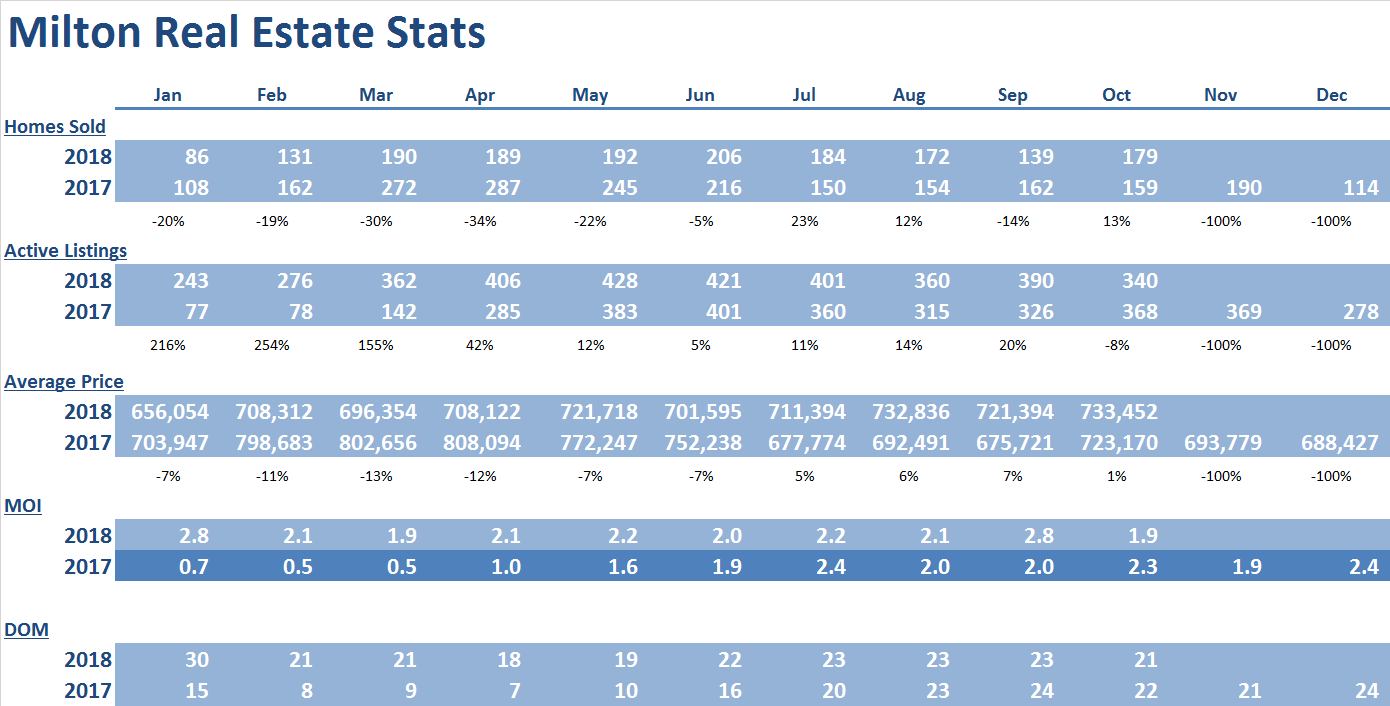
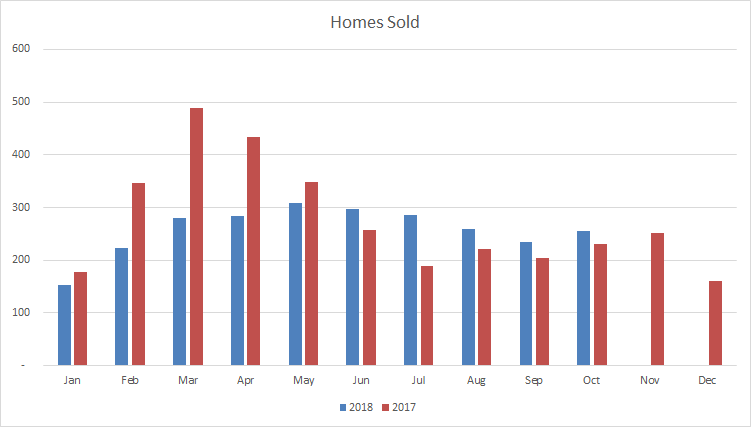
Milton
 |
 |
October was the fourth month this year with year-over-year price increase and the sixth monthly price increase since December of 2017. Prices in October 2018 rose 1% compared to October 2017 to $733,452. This was driven by the strength in most market segments. The October 2018 average price is down by 9% from the all-time high set in April of 2017 and up 7% from the end of 2017.
Supply tightened dramatically to under 2 months of inventory on hand and stands at 1.9. This tightening of supply will continue to create upward pressure on average prices moving forward.
Days on market tightened to 21 which represents a significant improvement from the beginning of the year, when days on market reached 30.
Year-to-date sales in Milton are only 13% lower than 2017, as sales increased 3 of the past four months, offsetting the decreases experienced during the beginning of the year (note: during March and April of 2018, Milton experienced unit sales decreases of 30% and 34% year-over-year, respectively).
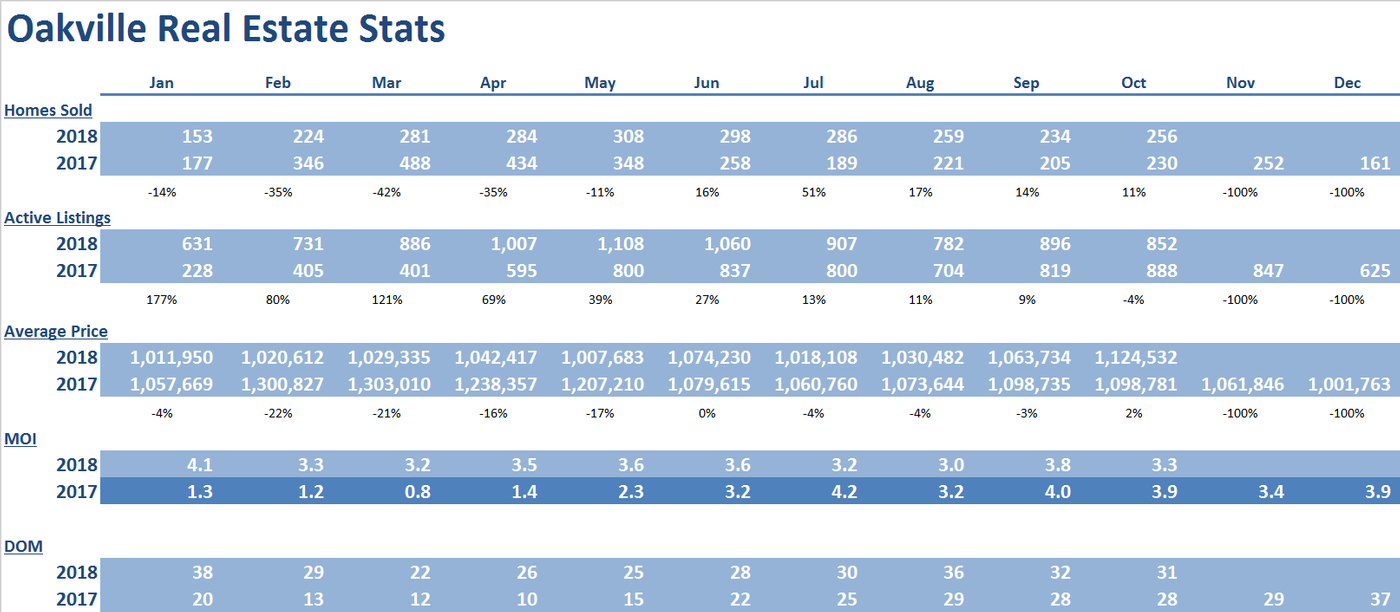
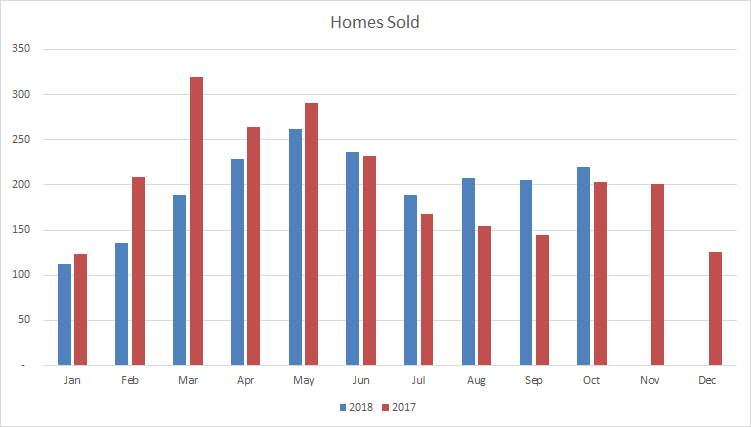
Oakville
 |
 |
Year over year sales increased for five consecutive months, rising 11% over October of 2017 to 256 homes.
October represents the first month of year over year price increases, as prices increased 2% over October of 2017 to $1,124,532. The monthly trend over the year has been increasing as there have been 8 monthly increases since December 2017. Accordingly prices are up 12% since the end of 2017. This was driven by increases across all market segments.
Supply tightened dramatically to 3.3 months of inventory on hand from 3.8 in September.
Days on market have tightened slightly to31, which represents a significant improvement from the beginning of the year, when days on market reached 38.
Burlington
 |
 |
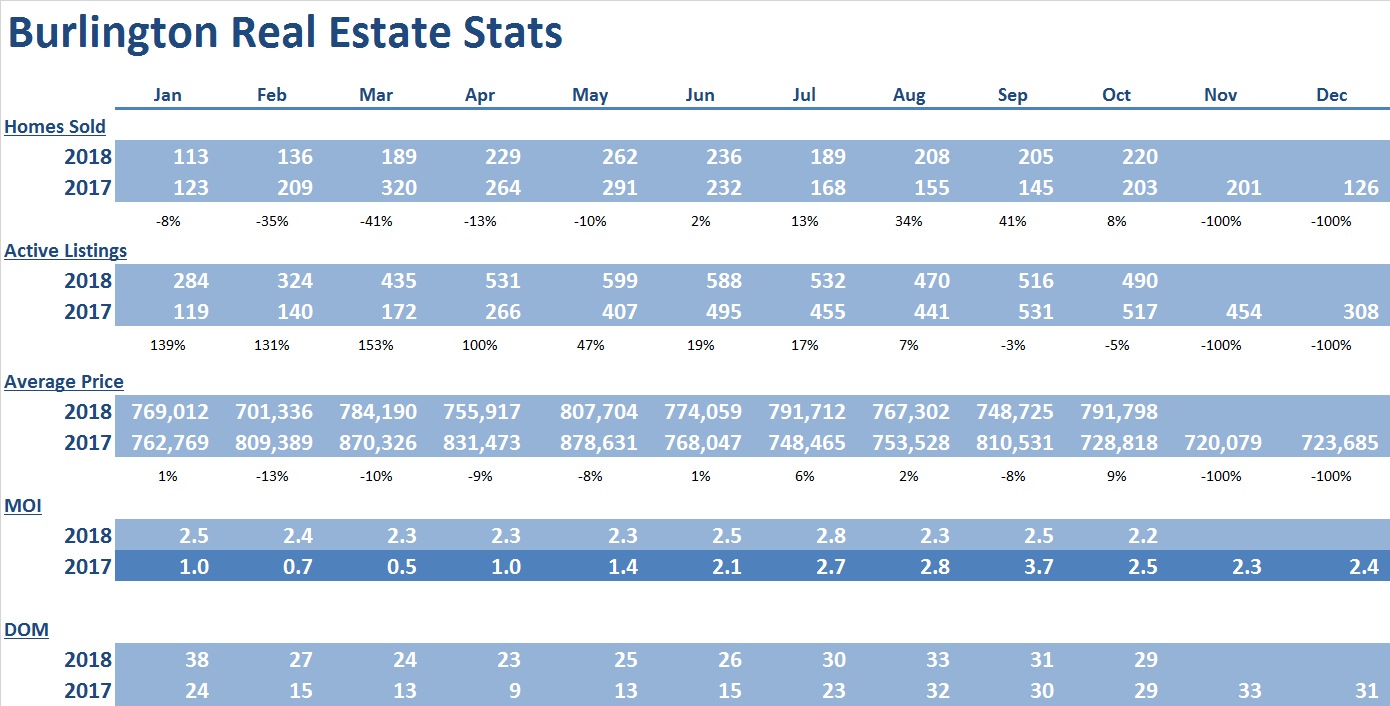
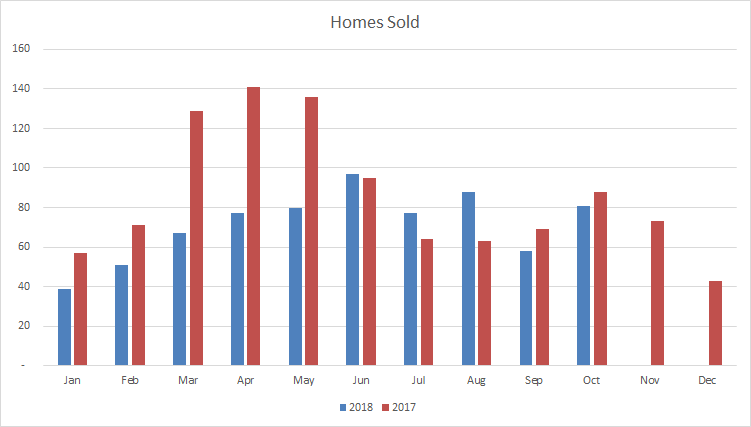
Year over year sales increased for five consecutive months, rising a 8% over October of 2017 to 220 homes. As a result, unit sales are only 6% lower than 2017 year-to-date.
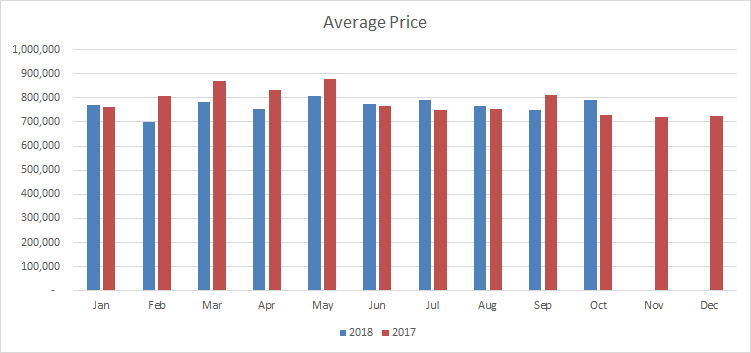
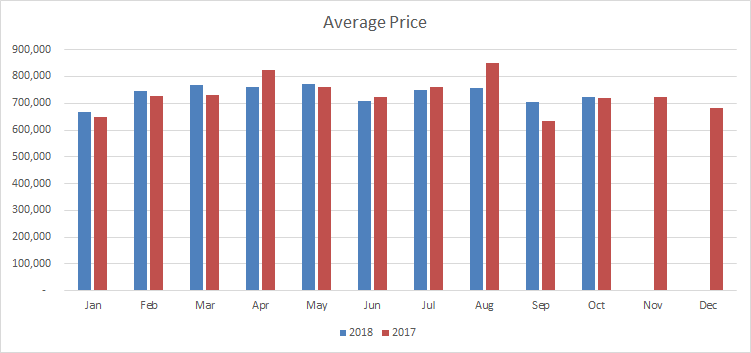
Prices have increased four of the past five months on a year-over-year basis. As a result, prices are 9% higher than the end of 2017 and only 10% lower than the all-time high reached in May of 2017. This was driven by increases across all market segments.
Supply tightened to 2.2 months of inventory on hand from 2.5 in the prior month. This tight supply should put upward pressure on prices moving forward.
Days on market have tightened up slightly to 29, which represents a significant improvement from the beginning of the year, when days on market reached 38.
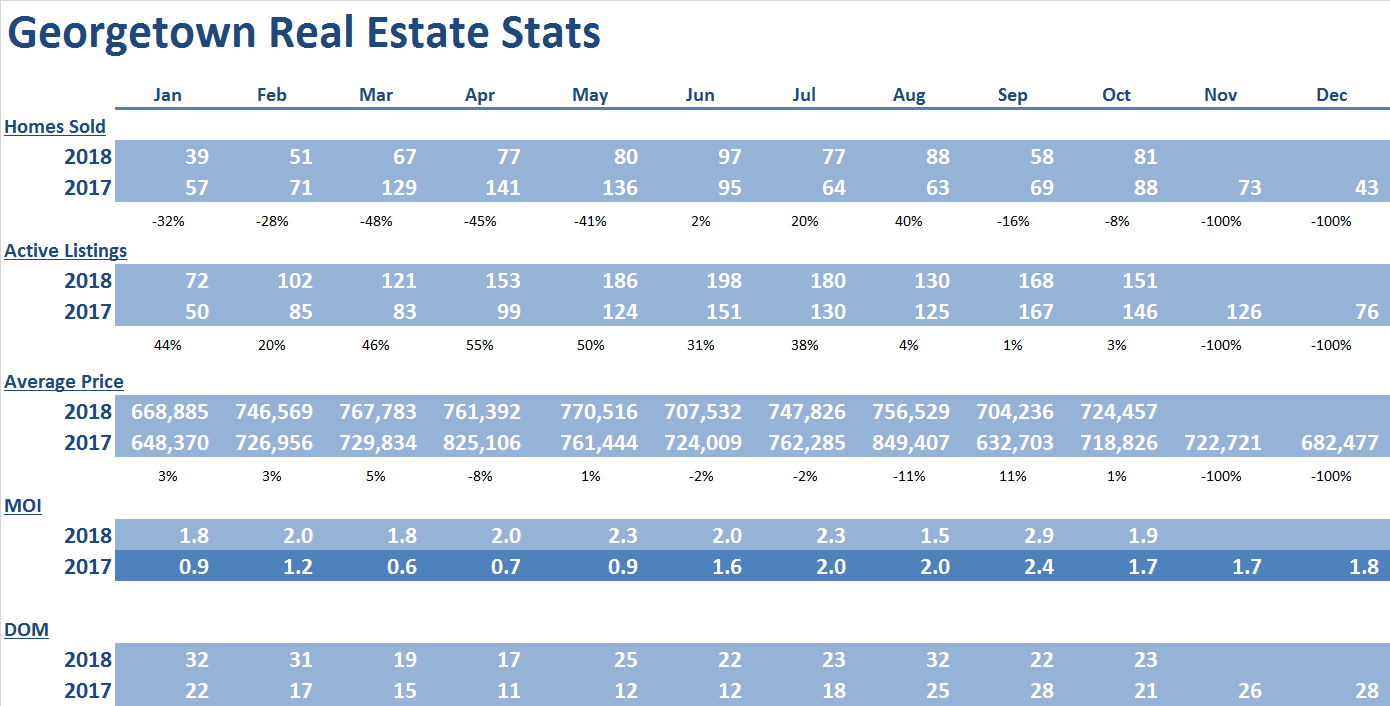
Georgetown
 |
 |
October prices are up 1% from the October of 2017. As prices have increased six times on a month-over-month basis since the end of 2017, the average price of $724,457 at the end of October is up 6% from the end of 2017.
Year over year sales increased for 3 of the past 5 months and as a result year-to-date sales are down 22% compared to 2017, which represents a dramatic improvement from the beginning of the year when year-over-year sales were down as much as 48% (February).
Supply decreased dramatically to1.9 months of inventory on hand from 2.9 in the prior month. This should continue to put upward pressure on prices moving forward.
Days on market have of 23 represents a dramatic improvement from the beginning of the year when days on market reached a high of 32.
Conclusion
Sales growth and decrease in active listings is creating a shortage of supply in the GTA. In fact, supply will likely remain below the historical average levels in many neighbourhoods in the Peel and Halton, which, over the long-term, should continue to put upward pressure on prices across all market segments.
*Some Key Economic indicators for a healthy real esatate forecast:
Peel Region expected to grow by 500,000 people in next 2 decades https://www.insauga.com/500000-new-residents-expected-in-mississauga-and-surrounding-cities-over-next-two-decades
Employment in September 2018 https://www150.statcan.gc.ca/n1/daily-quotidien/180907/dq180907a-eng.htm?HPA=1&indid=3587-2&indgeo=0
BOC raises rate Oct 24 2018 https://www.bankofcanada.ca/2018/10/fad-press-release-2018-10-24/
Key economic indicators – Statistics Canada https://www.statcan.gc.ca/eng/start
Consumer confidence index https://www.conference-board.org/data/consumerconfidence.cfm
#200 - 10 Kingsbridge Garden Circle
Mississauga, Ontario, L5R 3K6
Office: (905/416) 456-1000
Fax: ( 905) 502-1555
391 Main St. N.
Brampton, Ontario, L6X 1N7
Office: (905/416) 456-1000
Fax: (905) 456-8116
295 Queen St. E.
Brampton, Ontario, L6W 3R1
Office: (905/416) 456-1000
Fax: (905) 456-1924
#209 - 164 Sandalwood Pky. E.
Brampton, Ontario, L6Z 3S4
Office: (905/416) 456-1000
Fax: (905) 840-2344
New Listings
Open Houses
Homes For Lease
The RE/MAX Collection
Commerical Properties
Neighbourhood Watcher™
Neighbourhood Solds
Preferred Client Registration
Find My Dream Home
What's My Home Worth?
Mortgage Pre-Approval
Mortgage Calculator
Land Transfer Tax
The information contained on this site is based in whole or in part on information that is provided by members of The Canadian Real Estate Association, who are responsible for its accuracy. CREA reproduces and distributes this information as a service for its members and assumes no responsibility for its accuracy.
This website is operated by a brokerage or salesperson who is a member of The Canadian Real Estate Association.
The listing content on this website is protected by copyright and other laws, and is intended solely for the private, non-commercial use by individuals. Any other reproduction, distribution or use of the content, in whole or in part, is specifically forbidden. The prohibited uses include commercial use, "screen scraping", "database scraping", and any other activity intended to collect, store, reorganize or manipulate data on the pages produced by or displayed on this website.