THE TIME TO BUY REAL ESTATE IN THE GTA IS NOW
October 16, 2018 Real Estate

The recipe of higher unit sales and lower inventory creates a tighter market with rising prices. In fact, prices have been higher year over year for the fourth consecutive month. Prices are also up for 6 of the past 9 months.
Torontonians have come to the realization that waiting any longer will create a two-pronged challenge – increasing home prices and increasing borrowing costs – the Bank of Canada (BOC) increased interest rates by a quarter point four times since July 12, 2017. Although the BOC held interest rates at its most recent announcement on September 5th, it is very likely that interest rates will increase another quarter point on October 24, 2018. As a result, many understand that now is the time to buy.
The key factors leading to the increasing prices continues to be the combination of strong employment rate, historically low interest rates, and strong population growth*.
Brampton
 |
|
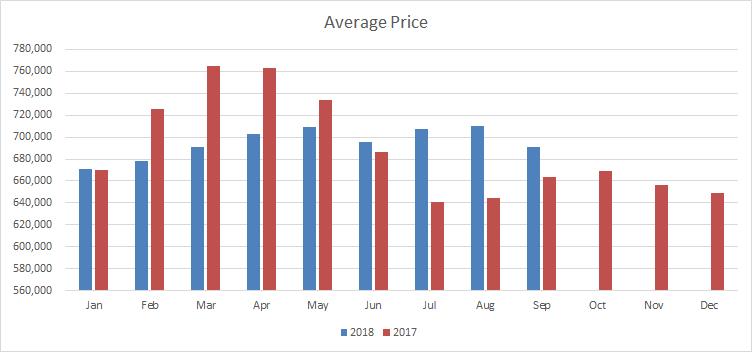
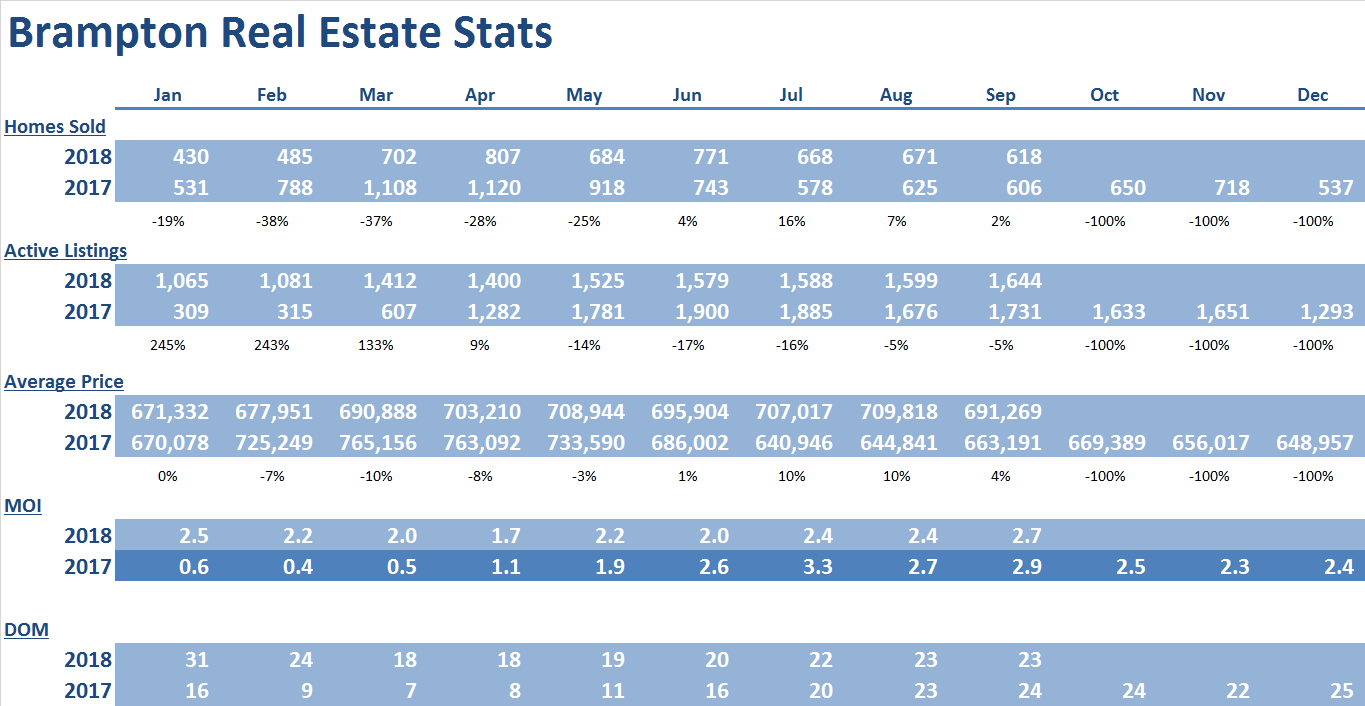
September was the 4th consecutive month with year-over-year price increases and there have been 7 monthly price increase since December of 2017. Prices have risen 7% since the end of 2017. Prices in September 2018 rose 4% compared to August of 2017 to $691,269. This was driven by strong increases in detached homes. The September 2018 average price is down by only 10% from the all-time high set in March of 2017.
Supply remains tight at just 2.7 months of inventory on hand. This tight supply will continue to create upward pressure on average prices moving forward.
Days on market have remained low at 23, which represents a significant improvement from the beginning of the year, when days on market reached 31.
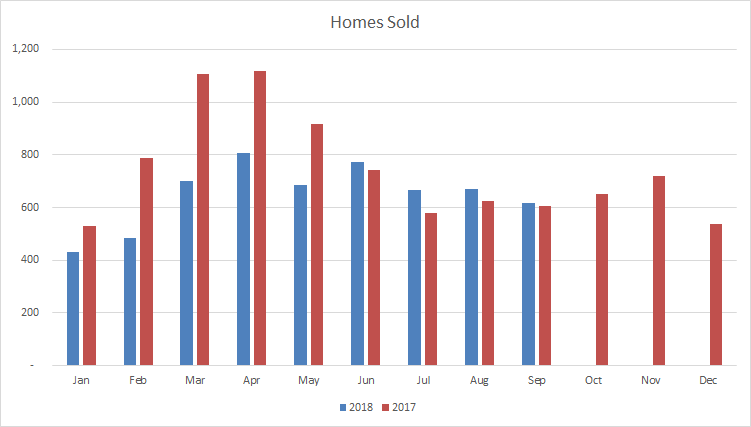
September represents the fourth consecutive month of year-over-year sales increases, rising 2% compared to the same month in 2017 to 618 homes. Year-to-date sales in Brampton are only 17% lower than 2017, as sales increases for the past four months have significantly offset the decreases experienced during the beginning of the year (note: during February and March of 2018, Brampton experienced unit sales decreases of 38% and 37% year-over-year, respectively).
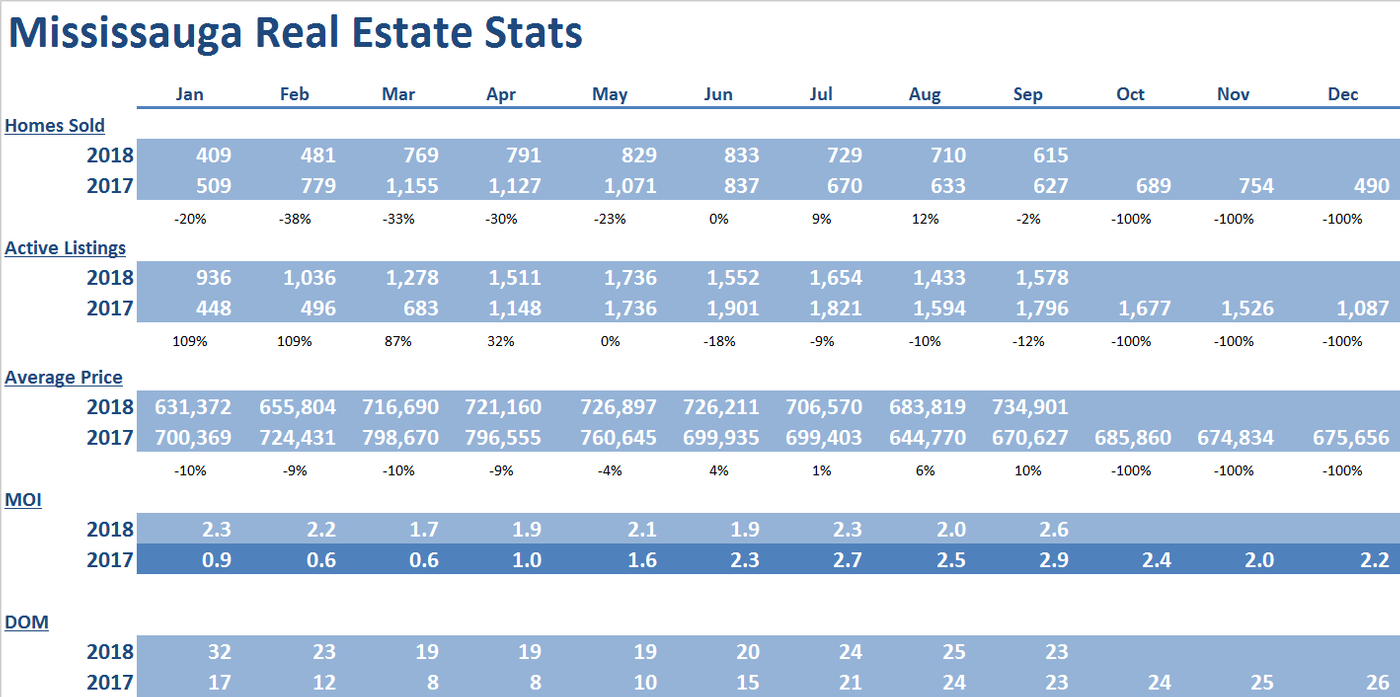
Mississauga
 |
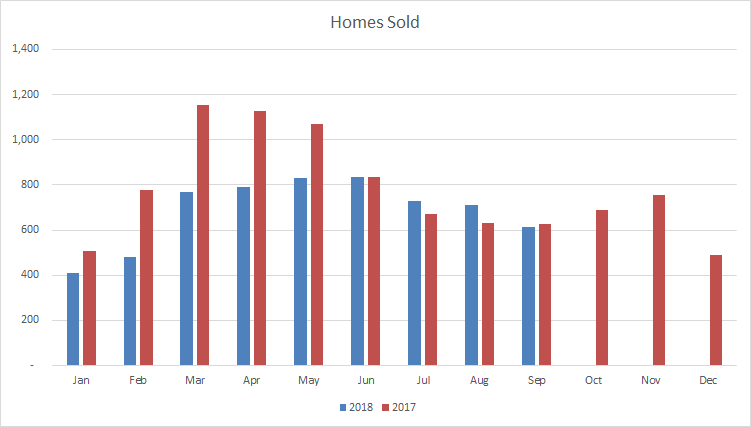 |
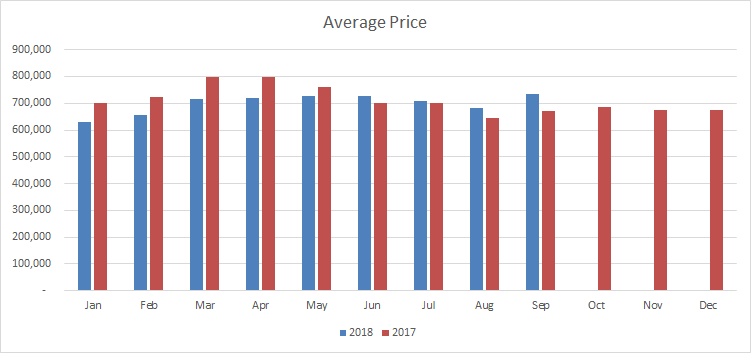
September was the fourth consecutive month of the year-over-year prices increases and the 6th monthly price increase since December of 2017. Prices have risen 9% since the end of 2017. Prices in September 2018 rose 10% to $734,901 compared to September of 2017. This was driven by strong increases across all housing types.
The September 2018 average price is down by only 8% from the all-time high set in March of 2017.
Supply remains very tight at 2.6 months of inventory. This supply will continue to create upward pressure on average price moving forward.
Days on market of 23, represents a significant improvement from the 32 days on market experienced earlier in the year.
Unit sales for the past 4 months have been approximately the same or higher than 2017 and this increased activity has significantly offset the decreases experienced during the beginning of the year (note: during February and March of 2018, Mississauga experienced unit sales decreases of 38% and 33% year-over-year, respectively).
Caledon
 |
 |
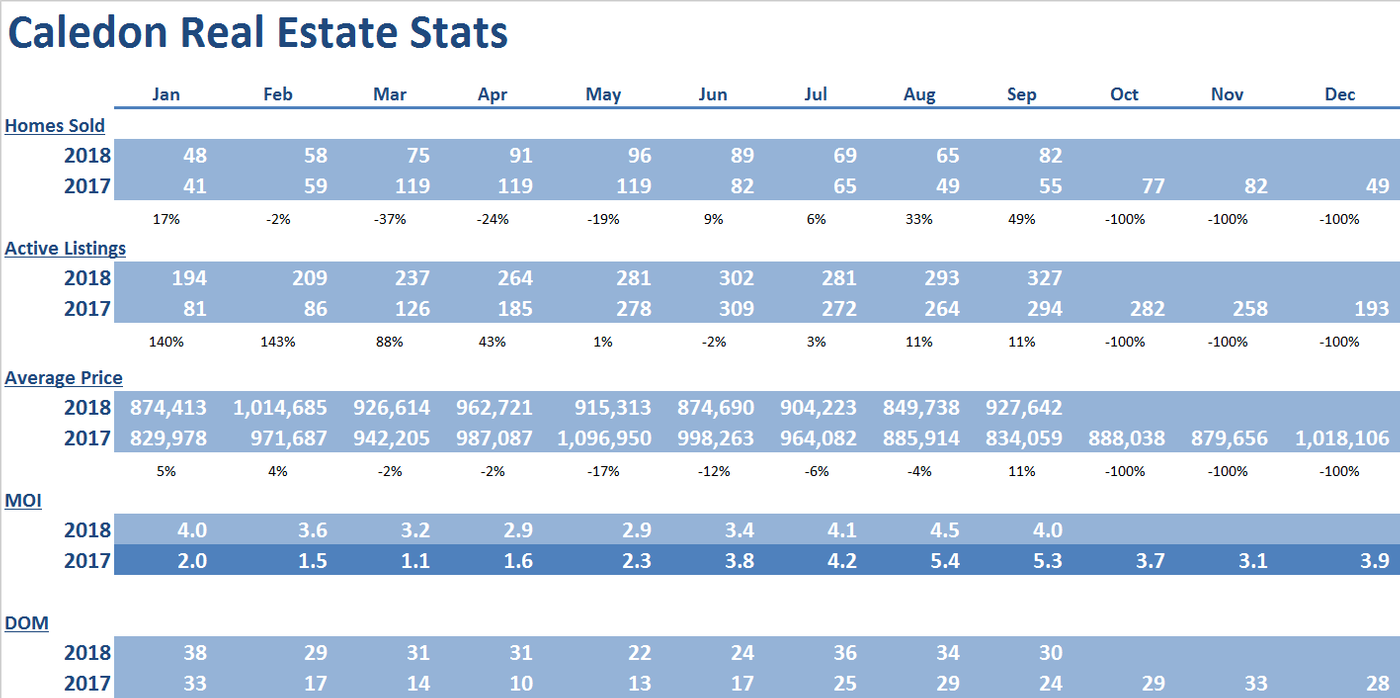
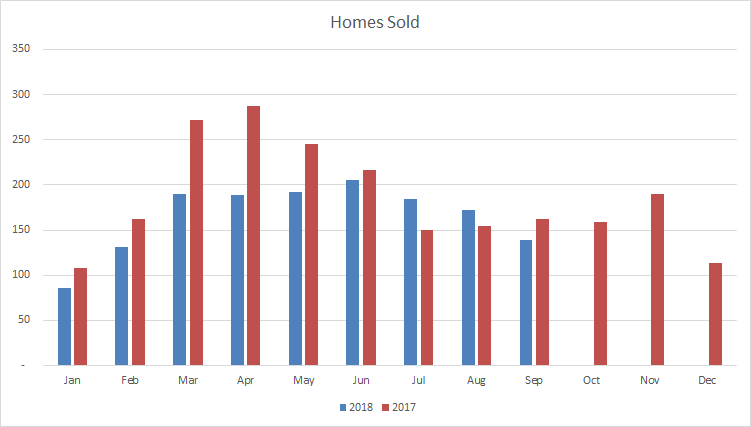
Year over year sales increased for four consecutive months, rising a dramatic 49% over September of 2017. As a result of the surge in sales activity during the past for months, year-to-date sales are only down 5% from 2017.
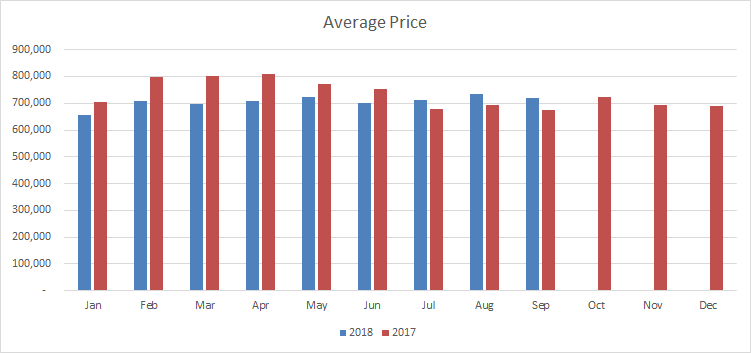
The average price in September of $927,642 is up 11% from September of 2017.
Supply tightened to 4 months from 4.5 months in the prior month and is in balanced market territory.
Days on market tightened slightly to 30 days from 34 days in the prior month.
Milton
 |
 |
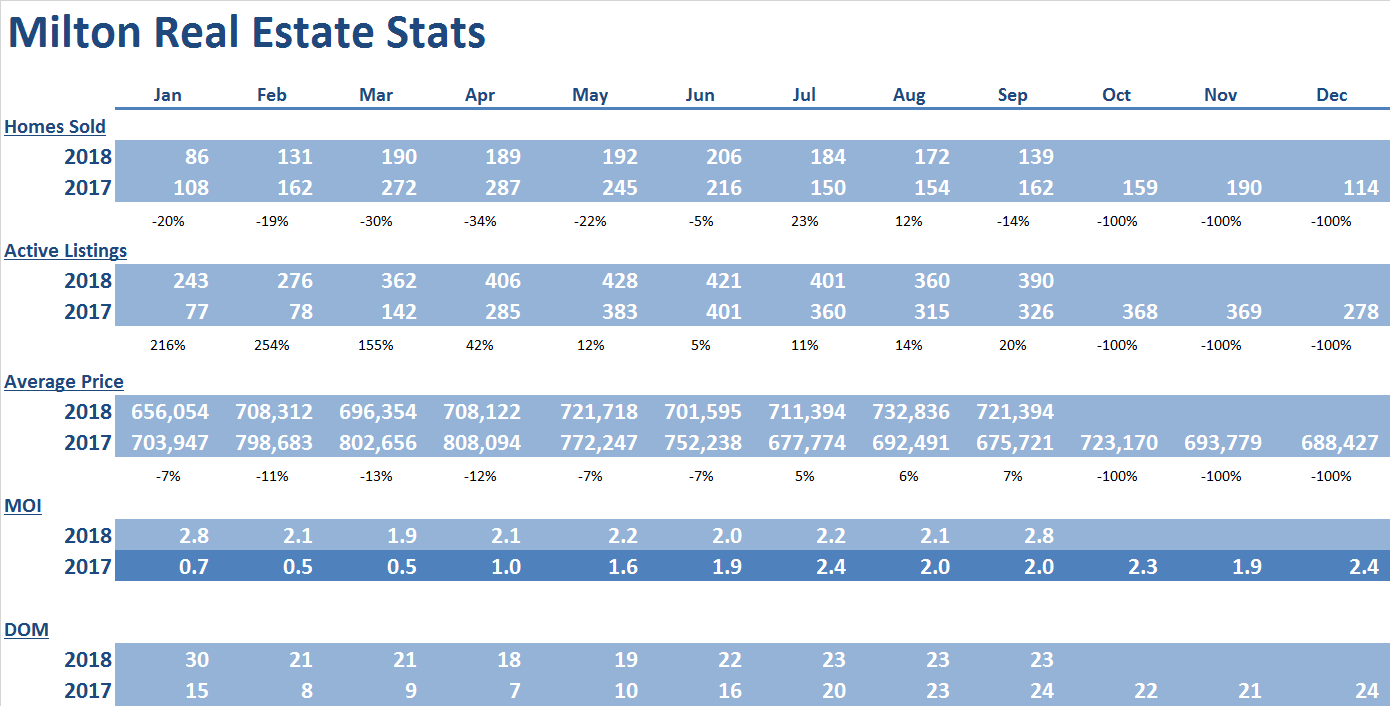
September was the third month this year with year-over-year price increase and the 5th monthly price increase since December of 2017. Prices in September 2018 rose 5% compared to September 2017 to $721,394. This was driven by the strength in condo’s and the semi-detached segments. The September 2018 average price is down by 11% from the all-time high set in April of 2017 and up 5% from the end of 2017.
Supply eased up to 2.8 months of inventory on hand. This level of supply is still in very tight territory, and accordingly will continue to create upward pressure on average prices moving forward.
Days on market have remained low at 23 which represents a significant improvement from the beginning of the year, when days on market reached 30.
Year-to-date sales in Milton are only 15% lower than 2017, as sales increases for 2 of the past three months have significantly offset the decreases experienced during the beginning of the year (note: during March and April of 2018, Milton experienced unit sales decreases of 30% and 34% year-over-year, respectively).
Oakville
 |
 |
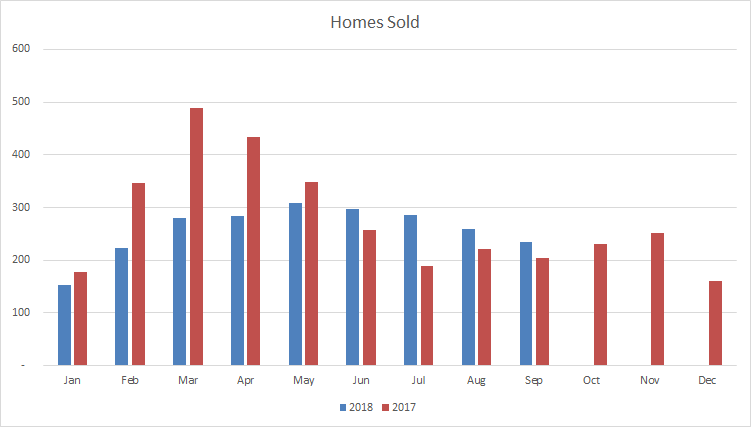
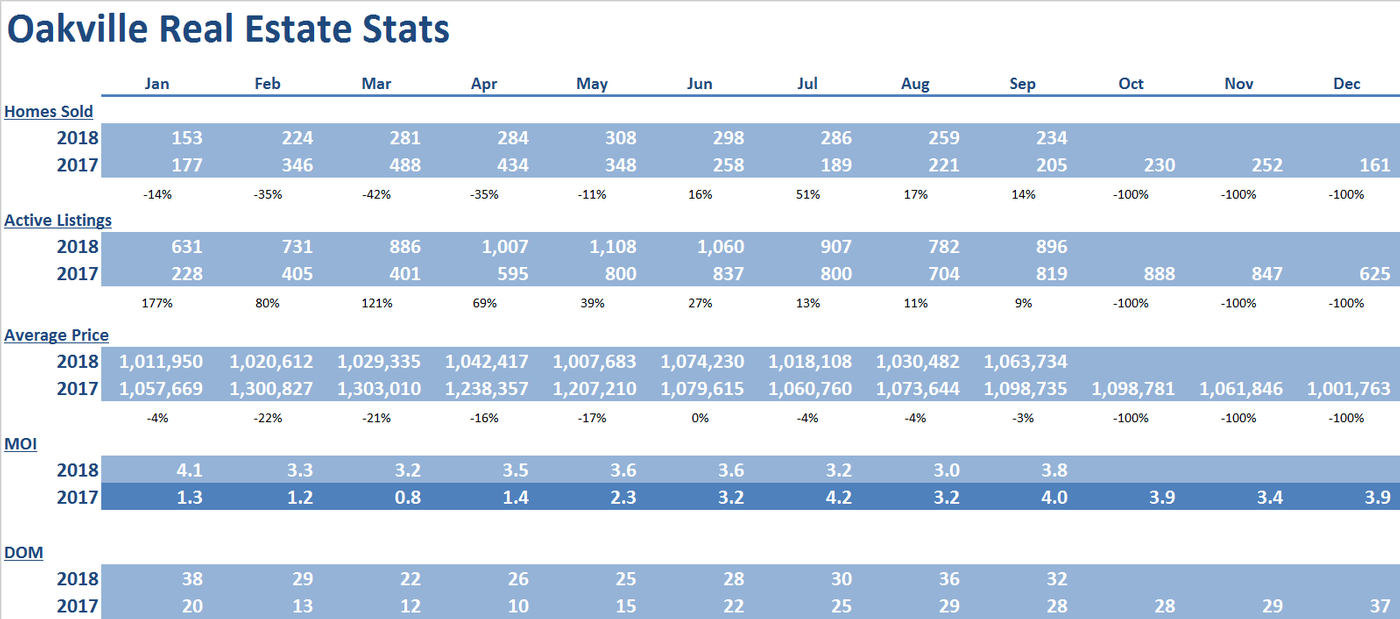
Year over year sales increased for 4 consecutive months, rising 14% over September of 2017 to 234 homes.
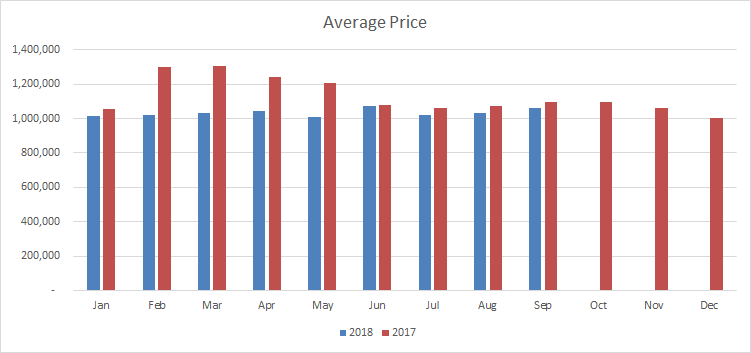
Although, prices in September 2018 decreased 3% to $1,063,734 compared to September of 2017, the trend is upwards as there have been 7 monthly price increases since December of 2017. Accordingly prices are up 6% since the end of 2017. This was driven by increases in the condo market.
Supply eased up to 3.8 months of inventory on hand, however this remains tighter than the beginning of the year when it hit 4.1 months.
Days on market have tightened up to 32, which represents a significant improvement from the beginning of the year, when days on market reached 38.
Burlington
 |
 |
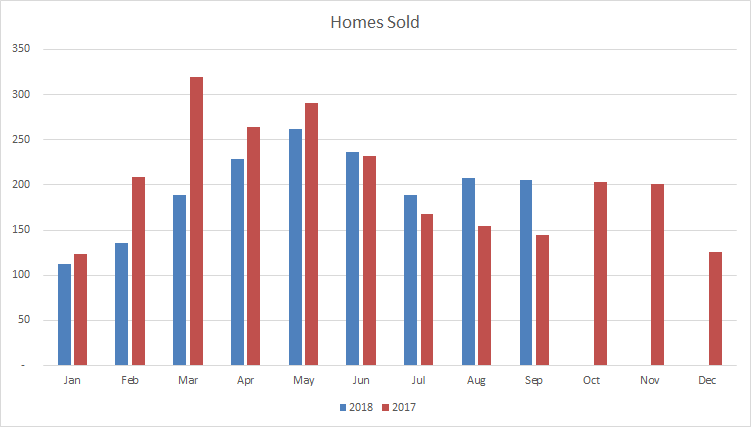
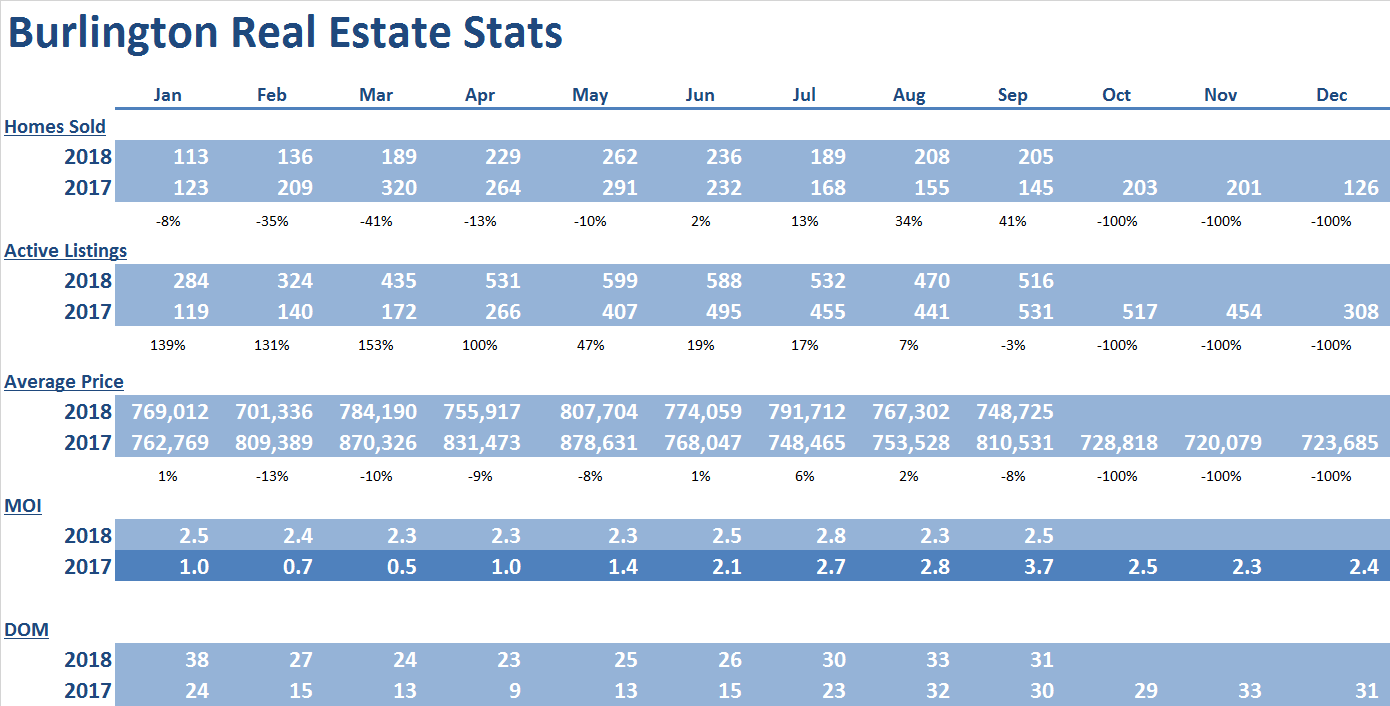
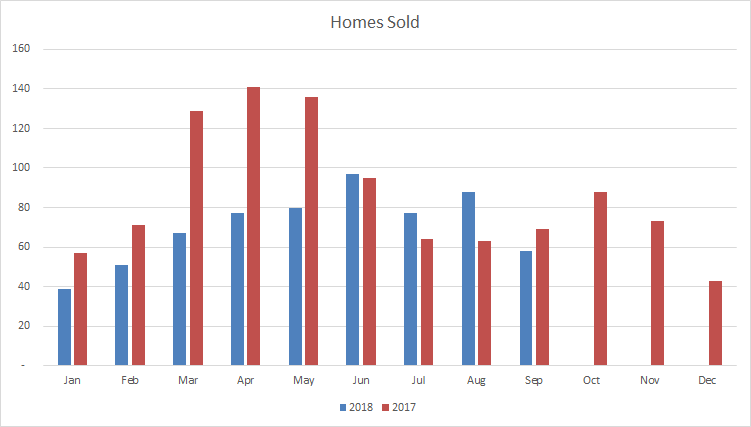
Year over year sales increased for four consecutive months, rising a dramatic 41% over September of 2017 to 205 homes. As a result, unit sales are only 7% lower than 2017 year-to-date.
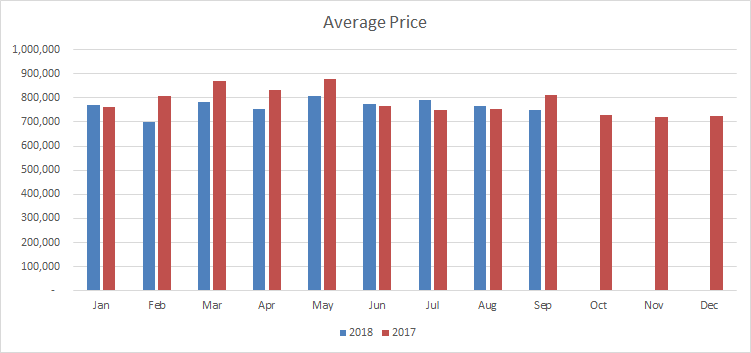
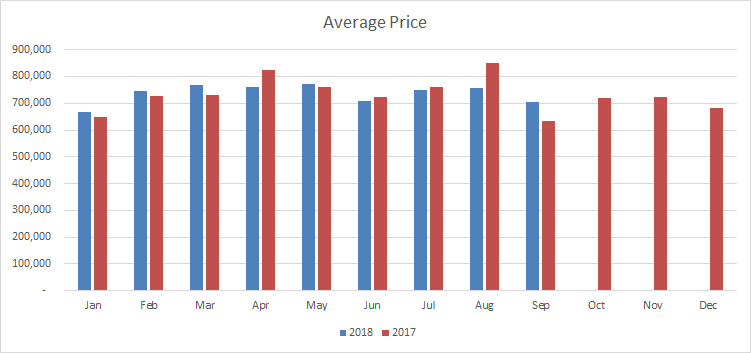
Prices have increased 3 of the past four months on a year-over-year basis. As a result, prices are only 7% lower than the high reached in May of 2017 and 3% higher than the end of 2017. This was driven by increases in the condo market.
Supply eased up slightly to 2.5 months of inventory on hand. This tight supply should put upward pressure on prices moving forward.
Days on market have tightened up slightly to 33, which represents a significant improvement from the beginning of the year, when days on market reached 38.
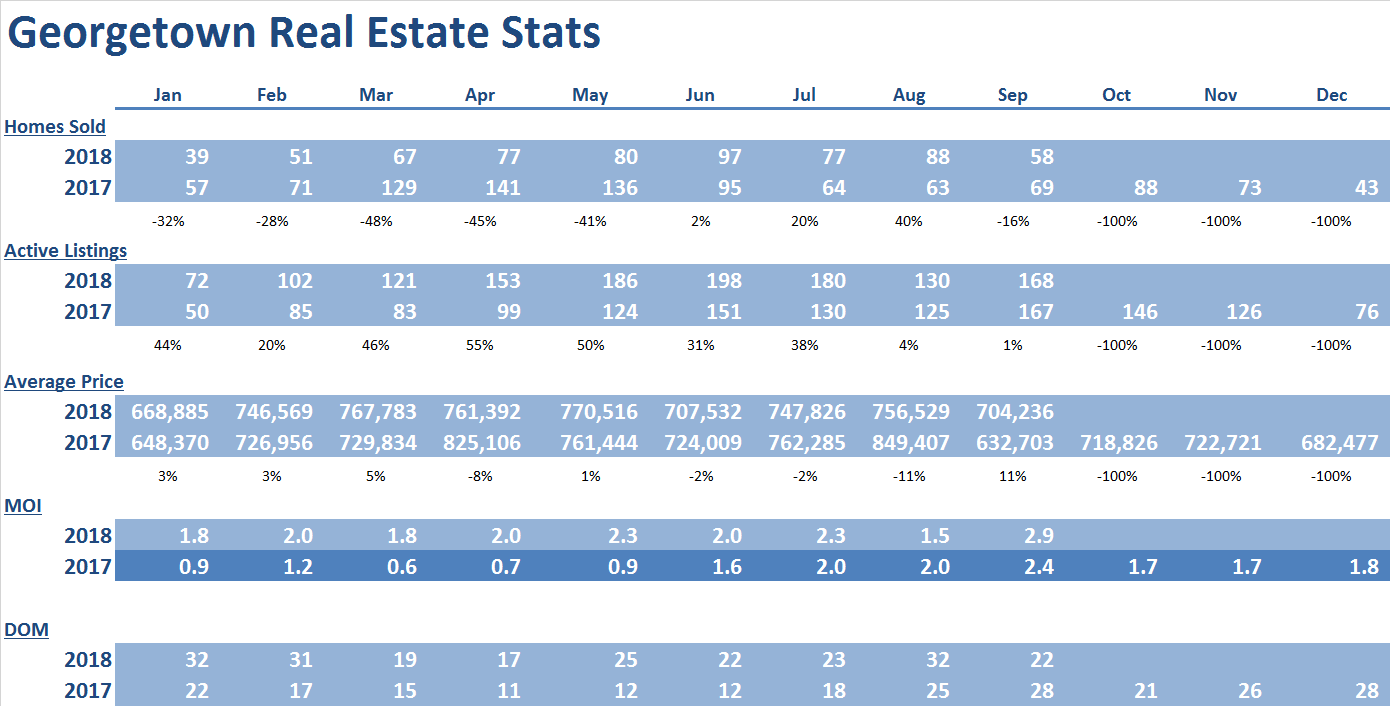
Georgetown
 |
 |
September prices are up 11% from the September of 2017. As prices have increased 5 times on a month-over-month basis since the end of 2017, the average price of $704,236 at the end of September is up 3% from the end of 2017.
Year over year sales increased for 3 of the past 4 months and as a result year-to-date sales are down 23% compared to 2017, which represents a dramatic improvement from the beginning of the year when year-over-year sales were down as much as 48% (February).
Supply eased up to 2.9 months of inventory on hand, but still represents a tight market. This should continue to put upward pressure on prices moving forward.
Days on market have decreased dramatically to 22, which bodes well from sellers moving forward.
Conclusion
As we move toward closing the year, growth in sales and selling prices is expected to continue. Expect stronger price growth in the comparatively more affordable townhouse and condominium apartment segments. This being said, listings supply will likely remain below the historical average in many neighbourhoods in the Peel and Halton, which, over the long-term, could put more upward pressure on prices across all market segments.
*Some Key Economic indicators for a healthy real estate forecast:
Peel Region expected to grow by 500,000 people in next 2 decades https://www.insauga.com/500000-new-residents-expected-in-mississauga-and-surrounding-cities-over-next-two-decades
Employment in Aug 2018 https://www150.statcan.gc.ca/n1/daily-quotidien/180907/dq180907a-eng.htm?HPA=1&indid=3587-2&indgeo=0
BOC maintains rate September 5 2018 https://www.bankofcanada.ca/2018/09/fad-press-release-2018-09-05/
Key economic indicators – Statistics Canada https://www.statcan.gc.ca/eng/start
Consumer confidence index https://www.conference-board.org/data/consumerconfidence.cfm
#200 - 10 Kingsbridge Garden Circle
Mississauga, Ontario, L5R 3K6
Office: (905/416) 456-1000
Fax: ( 905) 502-1555
391 Main St. N.
Brampton, Ontario, L6X 1N7
Office: (905/416) 456-1000
Fax: (905) 456-8116
295 Queen St. E.
Brampton, Ontario, L6W 3R1
Office: (905/416) 456-1000
Fax: (905) 456-1924
#209 - 164 Sandalwood Pky. E.
Brampton, Ontario, L6Z 3S4
Office: (905/416) 456-1000
Fax: (905) 840-2344
New Listings
Open Houses
Homes For Lease
The RE/MAX Collection
Commerical Properties
Neighbourhood Watcher™
Neighbourhood Solds
Preferred Client Registration
Find My Dream Home
What's My Home Worth?
Mortgage Pre-Approval
Mortgage Calculator
Land Transfer Tax
The information contained on this site is based in whole or in part on information that is provided by members of The Canadian Real Estate Association, who are responsible for its accuracy. CREA reproduces and distributes this information as a service for its members and assumes no responsibility for its accuracy.
This website is operated by a brokerage or salesperson who is a member of The Canadian Real Estate Association.
The listing content on this website is protected by copyright and other laws, and is intended solely for the private, non-commercial use by individuals. Any other reproduction, distribution or use of the content, in whole or in part, is specifically forbidden. The prohibited uses include commercial use, "screen scraping", "database scraping", and any other activity intended to collect, store, reorganize or manipulate data on the pages produced by or displayed on this website.