GTA HOME PRICES CONTINUE TO INCREASE
September 13, 2018 Real Estate

Hard to believe that it is a sellers market - believe it! There was approximately two and a half months worth of inventory on the market at the end of August. And predictively, prices continue to rise year over year for the third consecutive month. Prices are also up for 6 of the past 8 months. The industry considers it a sellers market when there is up to 4 months of inventory, a balanced market when there is 4-6 months and a buyers market when months of inventory is over 6 months.
Torontonians have come to the realization that waiting any longer will create a two-pronged challenge – increasing home prices and increasing borrowing costs - albeit, the Bank of Canada held interest rates at their most recent announcement on September 5th. As a result, many understand that now is the time to buy.
The key factors leading to the increasing prices continues to be the combination of strong employment growth, historically low interest rates, and strong population growth*.
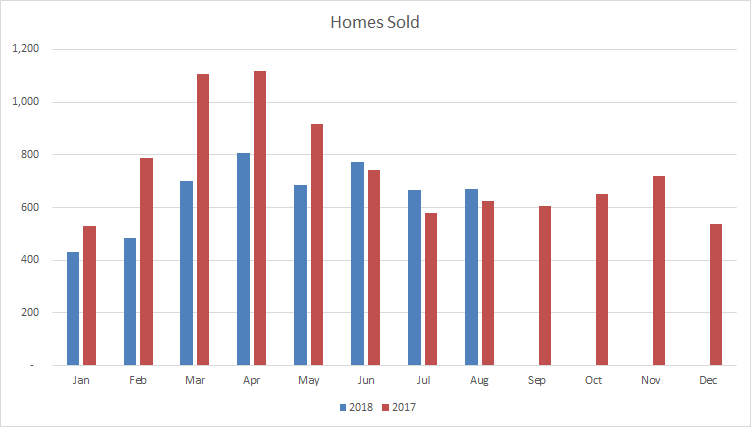
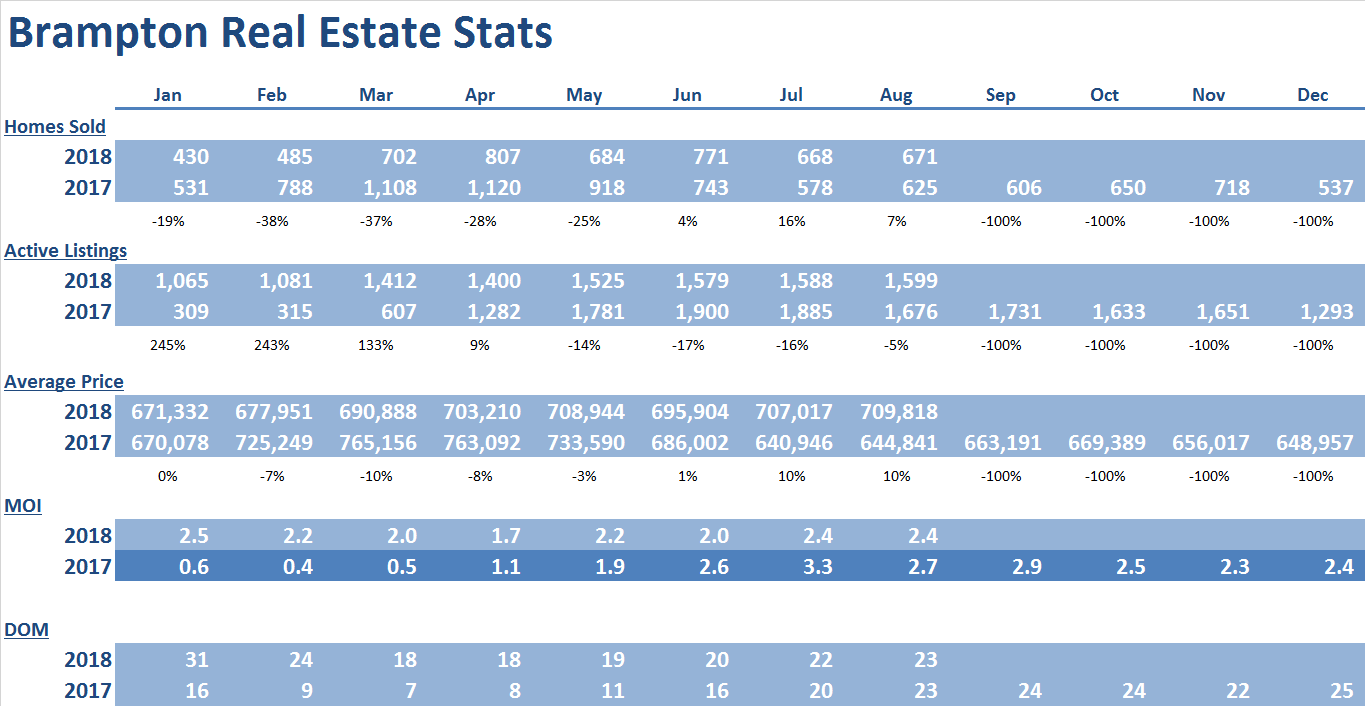
Brampton
 |
|
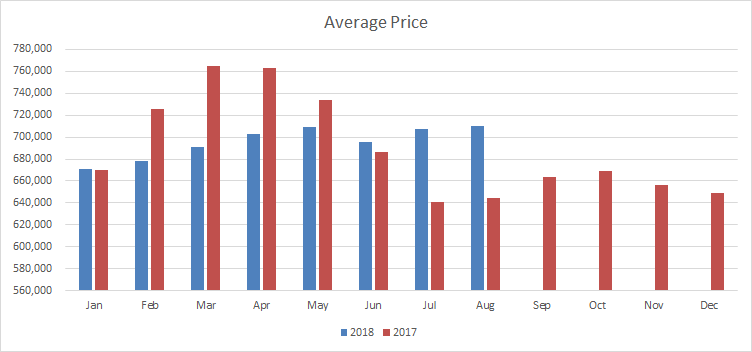
August was the third consecutive month with year over year price increases and the 7th monthly price increase since December of 2017. Prices in August 2018 rose 10% to $709,818 compared to August of 2017. This was driven by strong increases in detached homes. The August 2018 average price is down by only 7% from the all-time high set in March of 2017.
Supply remains tight at just 2.4 months of inventory on hand. This tight supply will continue to create upward pressure on average prices moving forward.
Days on market have remained low at 23, which represents a significant improvement from the beginning of the year, when days on market reached 31.
August posted the third consecutive month of year over year sales increases, rising 7% compared to the same month in 2017 to 671 homes. The current level of sales is consistent with the strong, yet more balanced activity experienced in 2013 and 2014.
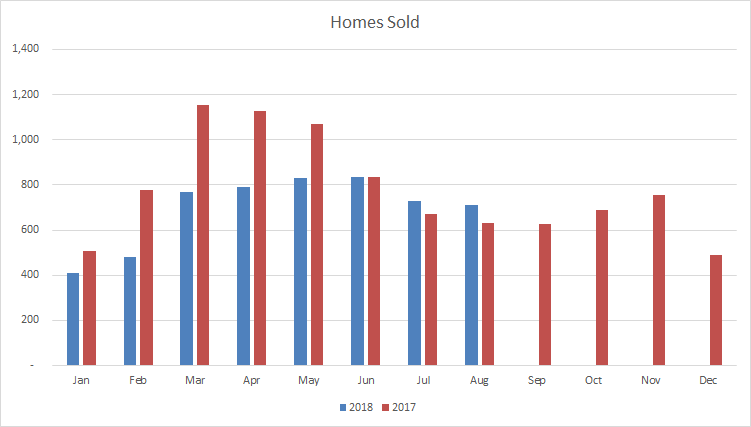
Mississauga
 |
 |
August was the third consecutive month of the year over year prices increases and the 6th monthly price increase since December of 2017. Prices in August 2018 rose 6% to $683,819 compared to August of 2017. This was driven by strong increases in the condo market.
Supply remains very tight at 2 months of inventory. This supply will continue to create upward pressure on average price moving forward.
Days on market are at 25, and represents a significant improvement from the 32 days on market experienced earlier in the year.
For the second consecutive month this year, sales are up year over year at 710 homes. The current level of sales is consistent with the strong, yet more balanced activity experienced in 2013 and 2014.

Caledon
 |
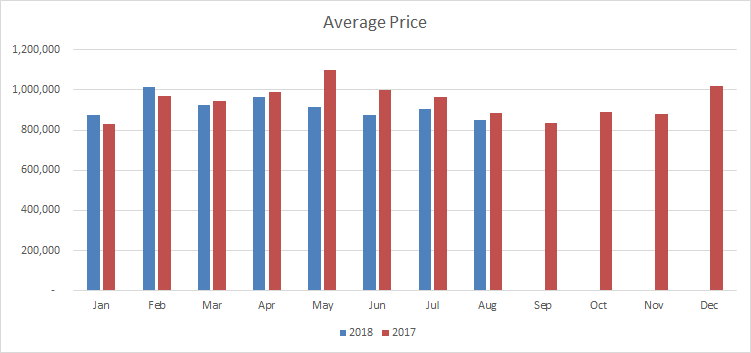 |
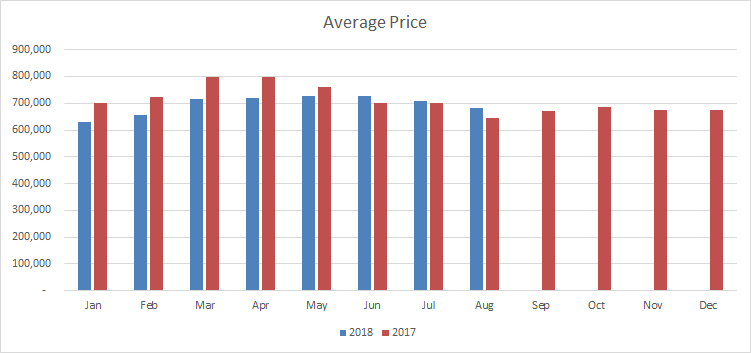
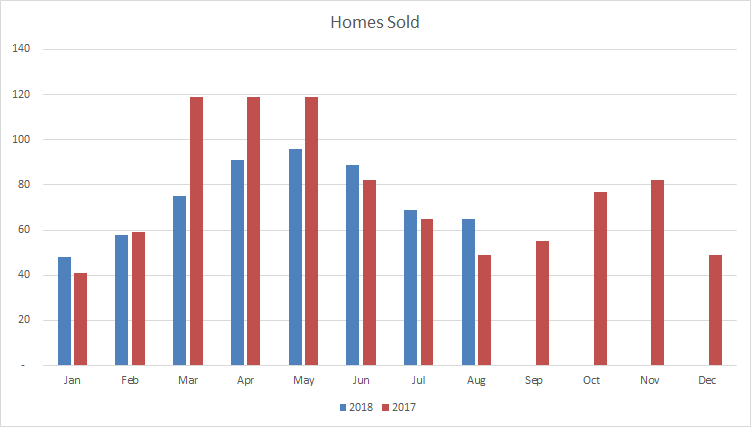
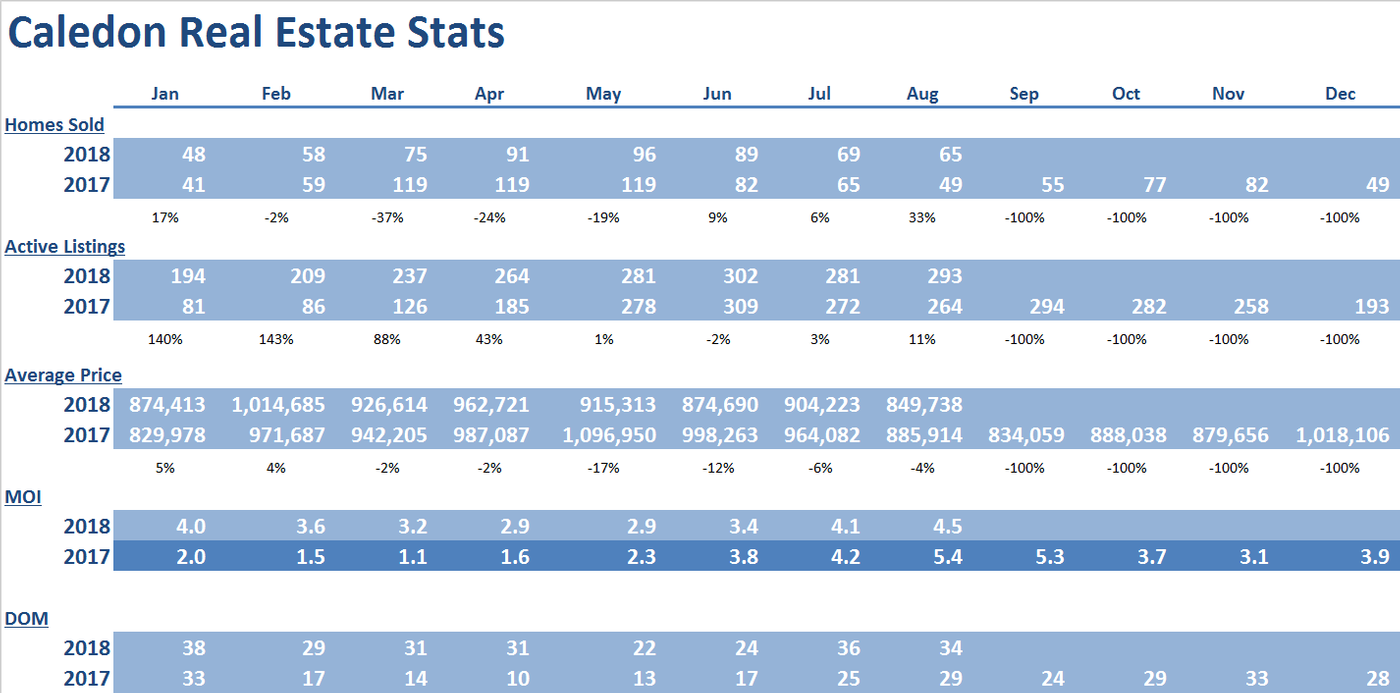
Year over year sales increased for 3 consecutive months, rising 33% over August of 2017.
The average price in August of $849,738 is down 4% from August of 2017. As there are relatively very few transactions that occur in Caledon on a monthly basis, the average price is significantly swayed by the mix of properties as opposed to a reflection of the trending of price. A clearer picture of Caledon’s market will appear in the fall.
Supply eased up to 4.5 months and is in balanced market territory.
Days on market tightened slightly to 34.
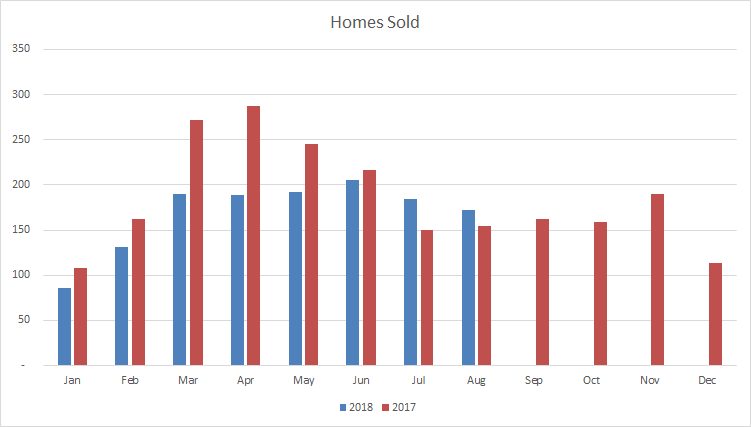
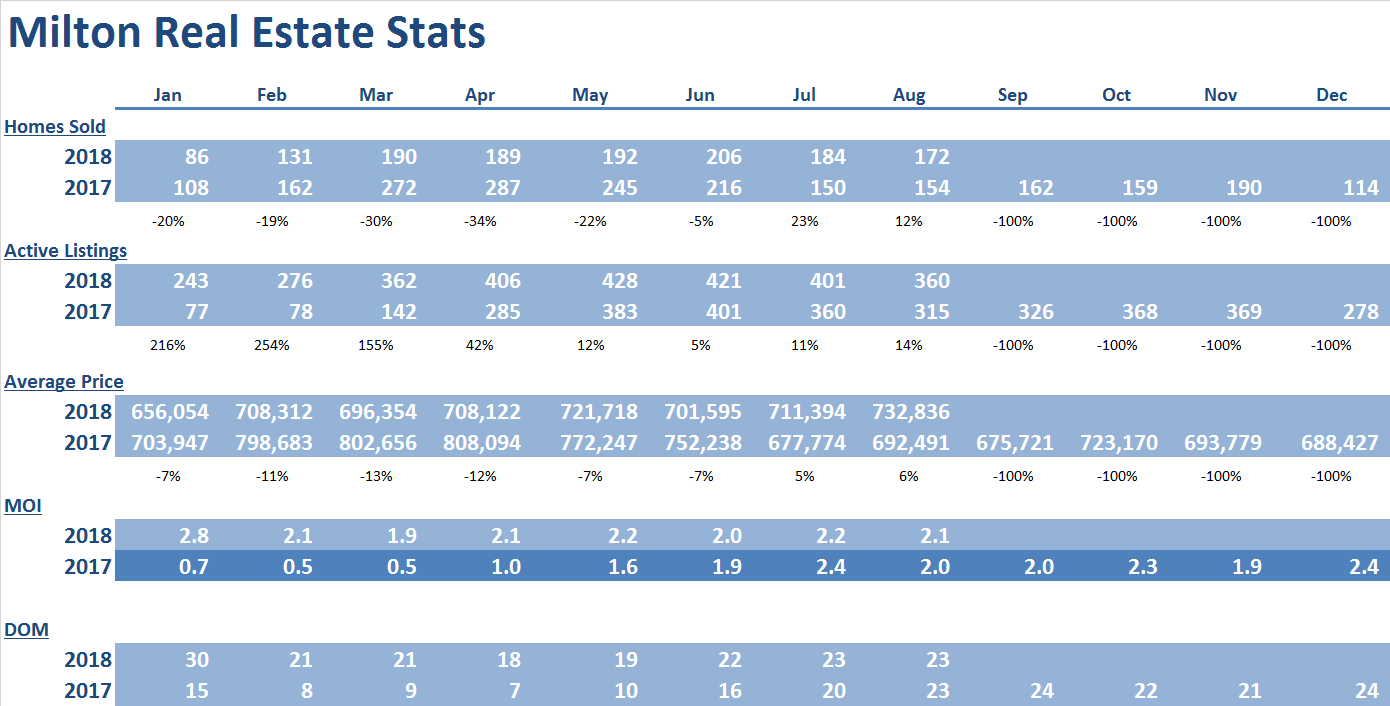
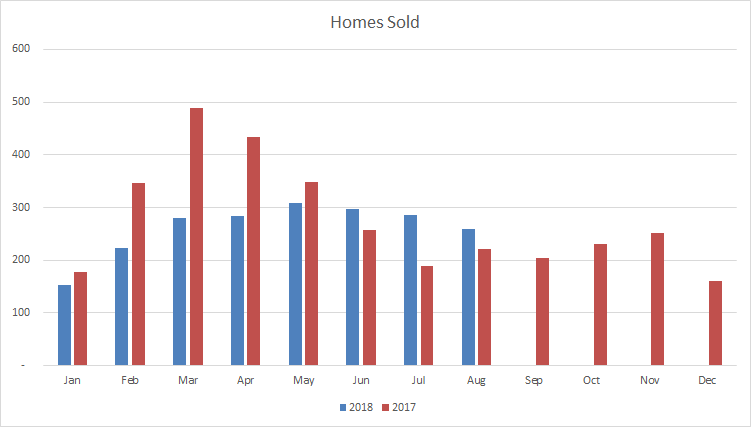
Milton
 |
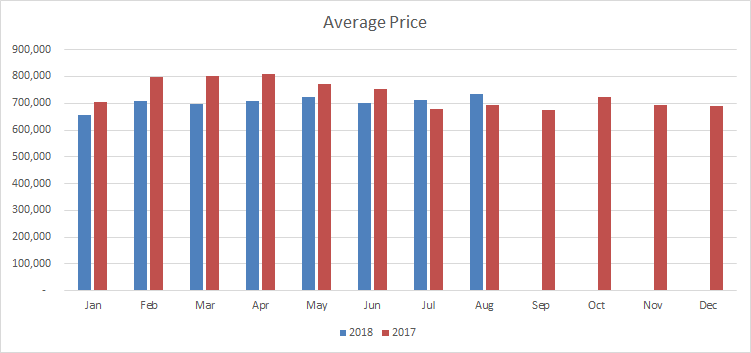 |
August was the second month this year, with year over year price increase and the 5th monthly price increase since December of 2017. Prices in August 2018 rose 6% to $732,836 compared to August of 2017. This was driven by the strength in detached homes segment. The August 2018 average price is down by only 9% from the all-time high set in April of 2017.
Supply tightened further to 2.2 months of inventory on hand. This tight supply will continue to create upward pressure on average prices moving forward.
Days on market have remained low at 23 which represents a significant improvement from the beginning of the year, when days on market reached 30.
August represents the second consecutive month this year with year over year sales increases. Sales rose by 12% compared to the same month in 2017 to 360 homes. The current level of sales is consistent with the strong, yet more balanced activity experienced in 2013 and 2014.
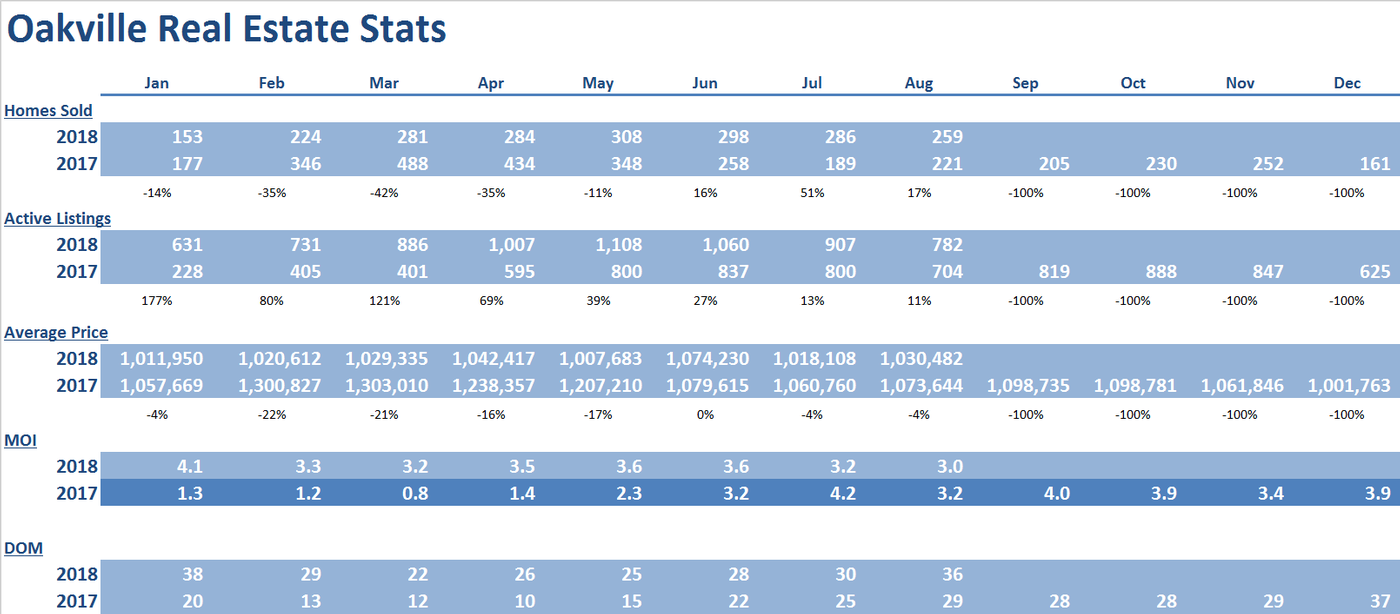
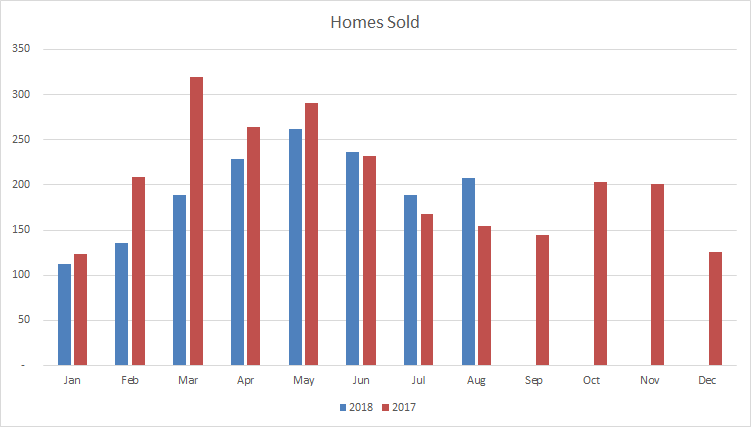
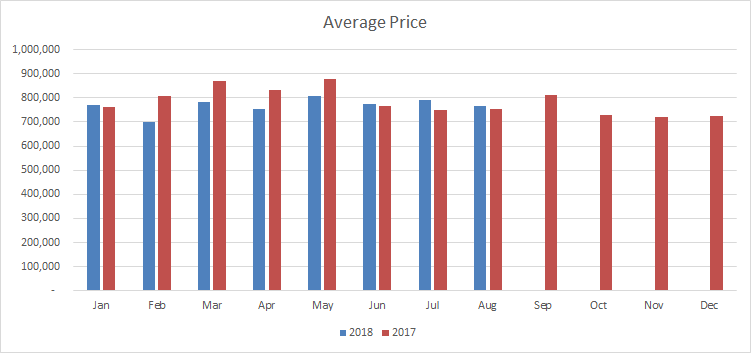
Oakville
 |
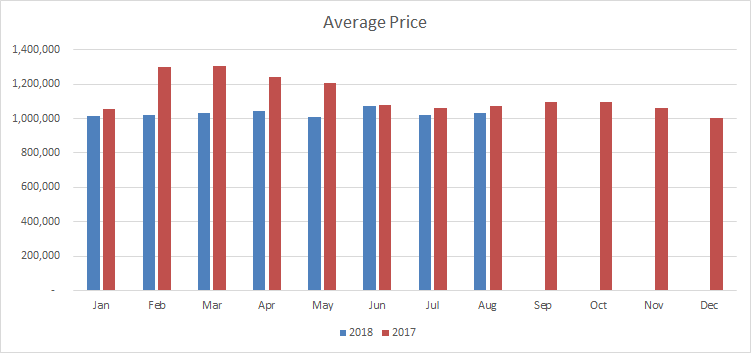 |
Year over year sales increased for 3 consecutive months, rising 17% over August of 2017 to 259 homes.
There have been 6 monthly price increases since December of 2017. Prices in August 2018 decreased 4% to $1,030,482 compared to August of 2017. August average prices are 3% higher than December of 2017. This was driven by increases in the condo market.
Supply tightened for the second consecutive month to 3 months of inventory on hand. This tightening of supply should create upward pressure on average prices moving forward.
Days on market have eased up to 36, which represents a slight improvement from the beginning of the year, when days on market reached 38.
Burlington
 |
 |
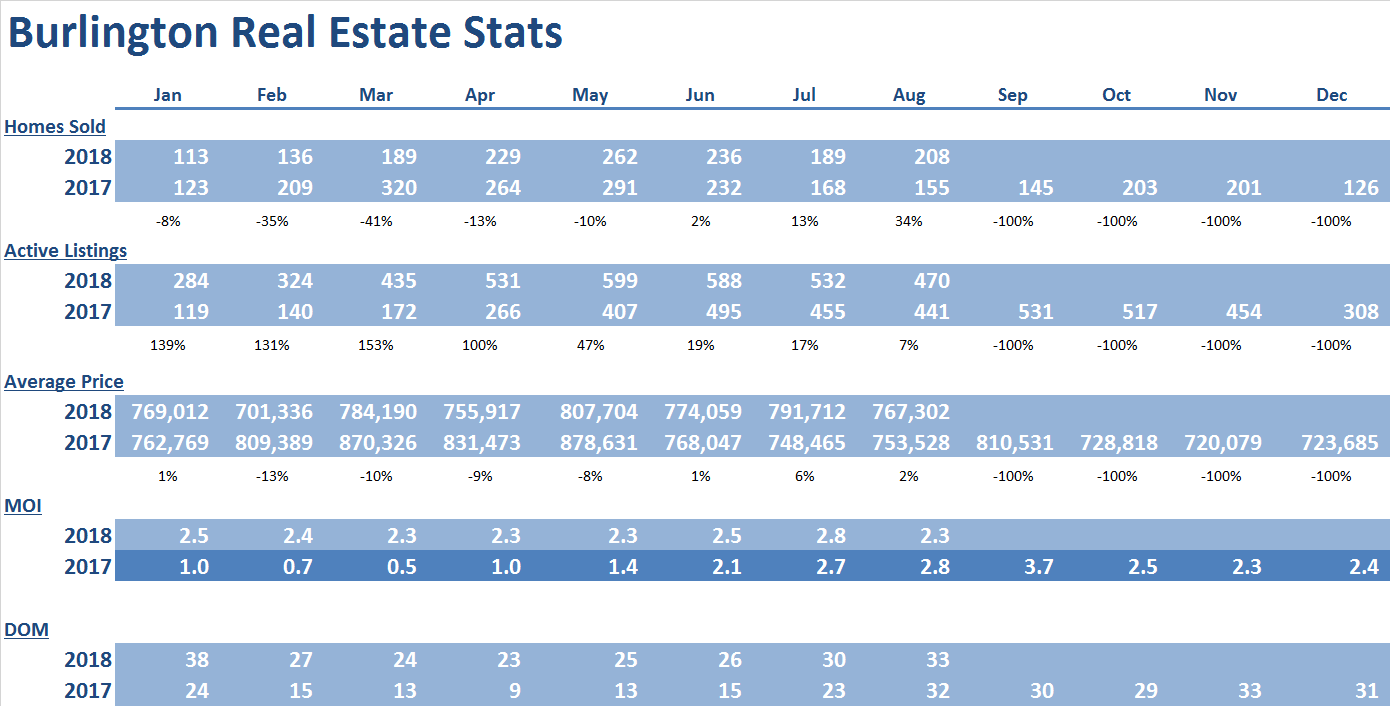
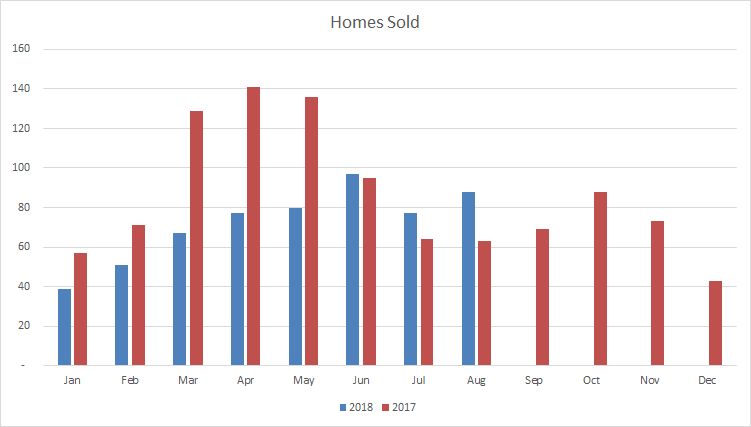
Year over year sales increased for 3 consecutive months, rising a dramatic 34% over August of 2017 to 208 homes.
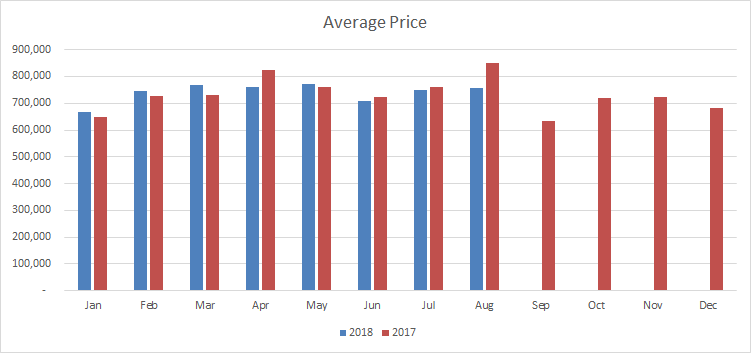
August was the third consecutive month of the year with year over year prices increases. Prices in August 2018 rose 2% to $767,302 compared to August of 2017. This was driven by strong increases in the condo market.
Supply tightened to 2.3 months of inventory on hand. This should put upward pressure on prices moving forward.
Days on market have eased up slightly to 33, which represents a significant improvement from the beginning of the year, when days on market reached 38.
Georgetown
 |
 |
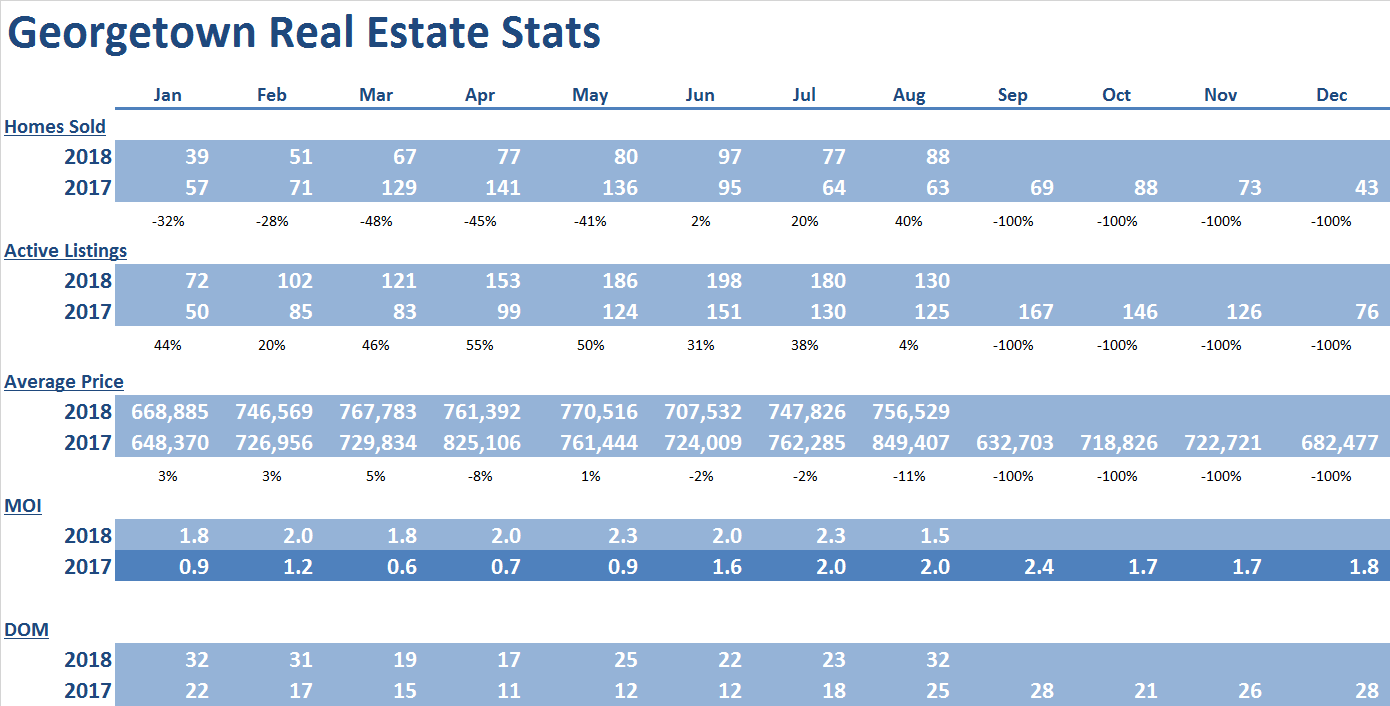
Year over year sales increased for 3 consecutive months, rising 40% over August of 2017 to 88 homes.
August represented the 5th monthly price increase since December 2017, as the average price reached $756,529. Prices in August 2018 are only down 8% from the all-time high reached in April of 2017.
Supply tightened dramatically to 1.5 months of inventory on hand, and represents the shortest supply in the GTA. This should put upward pressure on prices moving forward.
Days on market have eased up 32, which is consistent with the beginning of the year.
Conclusion
As we move further into the year, growth in sales and selling prices is expected to continue. Expect stronger price growth in the comparatively more affordable townhouse and condominium apartment segments. This being said, listings supply will likely remain below the historical average in many neighbourhoods in the Peel and Halton, which, over the long-term, could put more upward pressure on prices across all market segments.
*Some Key Economic indicators for a healthy real estate forecast:
Peel Region expected to grow by 500,000 people in next 2 decades
https://www.insauga.com/500000-new-residents-expected-in-mississauga-and-surrounding-cities-over-next-two-decades
Employment in Aug 2018
https://www150.statcan.gc.ca/n1/daily-quotidien/180907/dq180907a-eng.htm?HPA=1&indid=3587-2&indgeo=0
BOC maintains rate September 5 2018
https://www.bankofcanada.ca/2018/09/fad-press-release-2018-09-05/
Key economic indicators – Statistics Canada
https://www.statcan.gc.ca/eng/start
Consumer confidence index https://www.conference-board.org/data/consumerconfidence.cfm
#200 - 10 Kingsbridge Garden Circle
Mississauga, Ontario, L5R 3K6
Office: (905/416) 456-1000
Fax: ( 905) 502-1555
391 Main St. N.
Brampton, Ontario, L6X 1N7
Office: (905/416) 456-1000
Fax: (905) 456-8116
295 Queen St. E.
Brampton, Ontario, L6W 3R1
Office: (905/416) 456-1000
Fax: (905) 456-1924
#209 - 164 Sandalwood Pky. E.
Brampton, Ontario, L6Z 3S4
Office: (905/416) 456-1000
Fax: (905) 840-2344
New Listings
Open Houses
Homes For Lease
The RE/MAX Collection
Commerical Properties
Neighbourhood Watcher™
Neighbourhood Solds
Preferred Client Registration
Find My Dream Home
What's My Home Worth?
Mortgage Pre-Approval
Mortgage Calculator
Land Transfer Tax
The information contained on this site is based in whole or in part on information that is provided by members of The Canadian Real Estate Association, who are responsible for its accuracy. CREA reproduces and distributes this information as a service for its members and assumes no responsibility for its accuracy.
This website is operated by a brokerage or salesperson who is a member of The Canadian Real Estate Association.
The listing content on this website is protected by copyright and other laws, and is intended solely for the private, non-commercial use by individuals. Any other reproduction, distribution or use of the content, in whole or in part, is specifically forbidden. The prohibited uses include commercial use, "screen scraping", "database scraping", and any other activity intended to collect, store, reorganize or manipulate data on the pages produced by or displayed on this website.